
Maximizing Your Online Business with Ecommerce Performance Analytics Tools
- Technical Posts
The digital shelves of ecommerce stores are in perpetual motion. Market trends shift, customer behaviors evolve almost in real-time, and competitors are just a click away. For online retailers, simply knowing what happened with ecommerce performance (for example, that your conversion rate dropped last week) is not enough. The real competitive edge lies in understanding why. Why did 68% of potential customers abandon their shopping carts? Why are some product recommendations wildly successful, while others fall flat? Why do specific customer segments spend more, and what makes them loyal? What drives repurchasing behavior? In the customer journey, what pushes them from consideration to purchase?
For mid-sized ecommerce businesses, the struggle to answer these “why” questions is immense. Ecommerce businesses possess a goldmine of customer data – every click, every view, every search, every purchase, every return. Despite the abundance of data available for ecommerce customer analytics, extracting actionable insights often feels like searching for a needle in a haystack, blindfolded. It’s not about blaming existing analytics tools. Traditional Business Intelligence (BI) platforms excel at presenting aggregated data and illustrating historical trends. But for the nuanced, complex, and often hidden relationships that truly drive online shopping behavior, a new, more powerful approach to ecommerce performance analytics is no longer a luxury—it’s a necessity.

Every ecommerce brand lives and breathes by its Key Performance Indicators (KPIs): conversion rates, average order value (AOV), customer acquisition cost (CAC), and cart abandonment rate, just to name a few. You likely have dashboards that meticulously track these numbers, alerting you to spikes or dips in any ecommerce metrics. However, while these metrics reveal what has already occurred, they rarely explain the underlying mechanisms.
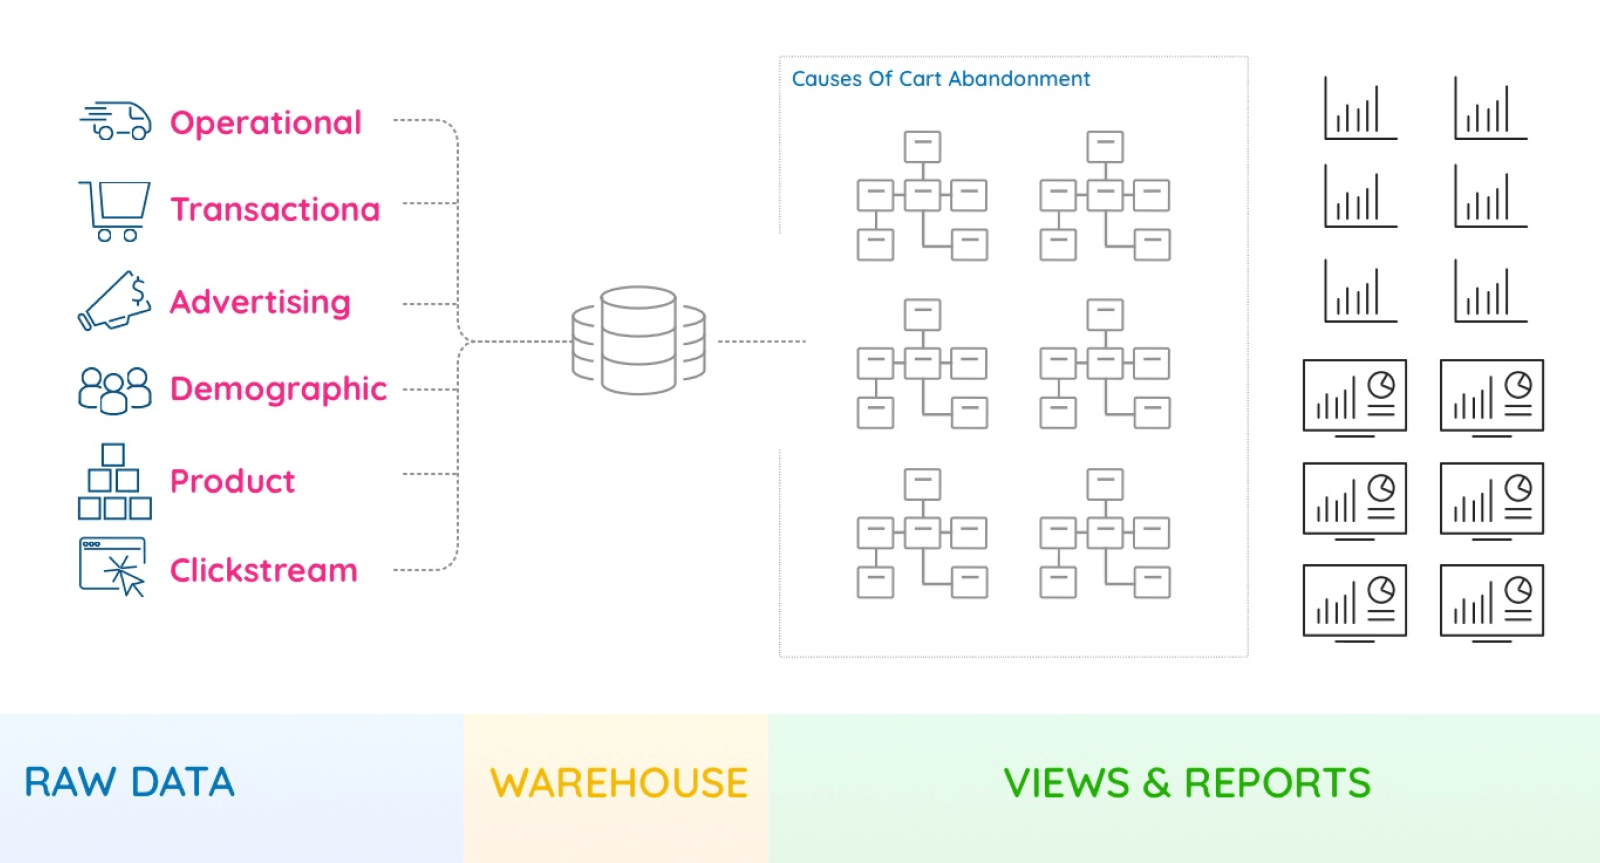
Consider the ubiquitous problem of shopping cart abandonment. Your BI dashboard might show a high abandonment rate, but it won’t tell you precisely which combination of factors – perhaps product category, cart value, shipping options presented, specific customer journey stage, or even device type – is driving that abandonment for particular customer segments. It’s a symptom without a diagnosis.
This challenge is amplified by the sheer ecommerce data deluge. Your ecommerce platform generates an astounding variety of data points:
Integrating this disparate data from various sources (your website analytics platform, CRM, ERP, marketing automation tools) into a cohesive analytical framework is a monumental task. For many mid-sized companies, this manual data preparation and integration can consume an inordinate amount of time and resources, often requiring specialized data engineering skills they simply don’t have readily available. The result? Insights are delayed, limited in scope, and frequently miss critical underlying drivers, adding to the already heavy workload of running an ecommerce business.
Here are some critical questions that traditional ecommerce analytics frequently struggles to answer, leaving businesses in a frustrating state of uncertainty:
These aren’t simple questions with straightforward answers. They require connecting dots across complex datasets, identifying subtle patterns, and understanding intricate relationships that are simply beyond the scope of traditional ecommerce analytics capabilities.
Business Intelligence (BI) tools are invaluable to ecommerce performance analytics. They provide robust reporting, performance dashboards, and the ability to track key trends over time. For understanding historical performance and monitoring standard KPIs, BI is essential. However, its core strength – relying on pre-defined queries and pre-defined data segments – becomes its Achilles’ heel when confronted with the need for more profound discovery and causal analysis.
Recognizing these limitations, many mid-sized ecommerce companies consider investing in data science. The promise of Machine Learning (ML) to unlock predictive power and deep insights is alluring. However, the reality often presents a significant bottleneck:
This leaves many mid-sized ecommerce businesses in a bind: traditional BI offers insufficient depth, and full-fledged data science teams are often out of reach or too slow to deliver timely, actionable and valuable insights in a fast-paced environment.
Imagine if your analytics platform could automatically sift through all your disparate ecommerce store data, not just to report numbers, but to discover the precise combinations of factors that drive specific customer behaviors. This is the power of Statistical AI, a revolutionary approach to deep analytics that goes beyond dashboards and automates the most challenging parts of data science.
Statistical AI, as embodied by platforms like dotData Insight, leverages advanced Machine Learning techniques specifically for signal discovery. It doesn’t require you to engineer every possible variable or hypothesis manually. Instead, it systematically explores all potential relationships within your data, unearthing the hidden “business drivers” that impact your key performance indicators. It bridges the gap between raw data and profound business understanding, democratizing capabilities traditionally reserved for large, expert data science teams.
Here’s how dotData Insight’s Statistical AI tackles the core challenges of ecommerce analytics:
This is the game-changer. Instead of manually hypothesizing and testing combinations of data points, dotData Insight automatically identifies and evaluates countless potential signals from your raw ecommerce data. It connects information across multiple tables and disparate sources – from customer demographics and browsing history to product attributes and marketing campaign data – to create a comprehensive list of potential “business drivers.”
Beyond identifying what drives a KPI, Statistical AI can pinpoint the optimal value parameters for each business driver that has the most significant impact on the performance metrics. This is where insights become truly actionable and prescriptive.
One of the most powerful aspects is the ability to “stack” these automatically discovered business drivers. This enables you to create incredibly precise, real-time microsegments of your customer base. As you combine drivers, dotData Insight instantly recalculates the combined impact on your key ecommerce metrics, allowing for hyper-personalized marketing strategies.
One of the most transformative aspects for mid-sized ecommerce brands is how Statistical AI, coupled with Generative AI, translates complex analytical findings into clear, actionable English sentences. This democratizes sophisticated insights, making them accessible not just to data scientists but to analytics professionals, merchandising managers, marketing executives, and even product development teams. A complex signal, such as “Purchase with Activity Date on weekdays (Mon-Fri) in the last 90 days,” becomes a clear and understandable business driver with its exact impact on your KPI.
Implementing Statistical AI for deep ecommerce data analytics isn’t just about getting more numbers; it’s about fundamentally changing how your business makes decisions and drives growth.
Beyond just improving the overall conversion rate, Statistical AI helps you identify the exact friction points and successful pathways within your online store. For example, it might discover that customers who encounter a specific payment gateway error message and have more than five items in their cart are almost certain to abandon their purchase. Or, conversely, that seeing a “customer reviews” widget with a specific average rating on the product page significantly increases the conversion rate for first-time visitors. This allows for surgical improvements to your customer experience and checkout flow.
Understanding lifetime value (LTV) is crucial, but predicting and influencing it is complex. Statistical AI uncovers the unique combinations of behaviors and product interactions that build lasting customer relationships. It might reveal that “customers who engaged with three different content types (blog, video, social post) and purchased an item from a specific ‘eco-friendly’ product line within their first 60 days have a 2x higher LTV over two years.” This insight can guide acquisition strategies to target customers with similar profiles, as well as nurture existing ones.
Gone are the days of broad category analysis. Statistical AI helps you understand granular demand drivers for specific products or categories. It can identify patterns such as: “products purchased on weekends with a specific color attribute and viewed via paid social media channels have a 20% higher return rate when not accompanied by a size guide view.” Or, “customers who added three or more items from the ‘new arrivals’ category on a Tuesday purchase an upsell item if presented with an automated recommendation 35% more than when the recommendation is not presented.” This enables more precise inventory management, product placement, and promotional strategies.
Returns are a significant cost for online businesses. Statistical AI can help identify early signals of potential returns based on customer behavior before the item is even shipped. It might discover that “customers who purchase items from Brand Y, have viewed the size guide less than once, and have a prior return history for clothing items, return their purchases 45% more frequently.” This insight empowers your team to send targeted follow-up emails with sizing assistance, offer proactive exchanges, or even adjust product descriptions to mitigate future returns.
The online retail landscape demands more than just data. It requires deep understanding, rapid insights, and the ability to act with precision. While traditional BI and even standard data science approaches have their place, they often fall short in delivering the granular, actionable intelligence needed to thrive in today’s competitive ecommerce world, especially for mid-sized companies without limitless resources.
Statistical AI, with its automated feature discovery, magic threshold identification, and human-readable insights, represents a fundamental shift. It empowers analytics professionals to deliver profound insights faster, enables data science leaders to accelerate projects and democratize advanced capabilities, and, crucially, allows line-of-business users and executives to directly leverage complex analytical findings to make informed, impactful decisions.
It’s time to move beyond the “what” and dive deep into the “why” of your ecommerce success. The unseen forces shaping your online store are waiting to be uncovered, and with the right analytical approach, you can harness them to drive unprecedented growth and customer satisfaction. Explore how a data analytics platform designed for deep actionable insights can transform your ecommerce operations and unlock the true potential of your data.