fbpx

How to Pinpoint What Drives Early-Stage Delinquency Roll Rate

  • Industry Use Cases

In the subprime lending and credit card industry, risk isn’t just a metric; it’s a dynamic, fast-moving current. You monitor portfolio health daily, but some of the most critical signals aren’t in the high-level dashboards. They’re hidden in the subtle shifts—the moments when a small problem begins to snowball into a significant loss.

One of the most dangerous of these is the early-stage delinquency roll rates. This is the percentage of your borrowers who “roll” from one delinquency bucket to the next in a given month, for instance, from 30 days past due to 60 days past due (DPD). While a 90-day delinquency is a clear signal of potential losses, the battle is often won or lost in those first 60 days. A rising roll rate is a leading indicator of future charge-offs, increased provisioning costs, and stress on your collections resources.

For a subprime lender with a lean team, the question is stark: You see higher roll rates. You know the “what.” But do you know the “why”? And can you find a solution quickly enough? Pinpointing the precise drivers and factors behind these rising or falling roll rates in a portfolio of thousands of loans is a monumental task. The answer isn’t buried in a single column of data; it’s woven into the complex interactions between dozens of variables across your entire business.

This article examines the crucial importance of delinquency roll rate analysis, the prohibitive costs and limitations of traditional tools for this task, and how a new approach—Statistical AI—can enable lenders to stay ahead of the delinquency curve.

Analyze historical roll rates to identify high risk customer segments

The High-Stakes Math of Delinquency Roll Rates

Let’s be clear: monitoring roll rates in early delinquency stages isn’t an academic exercise. It has a direct and immediate impact on your bottom line. According to data from the Federal Reserve Bank of New York, as of early 2024, an increasing share of auto loan debt has been transitioning into delinquency, with rates for lower-income borrowers surpassing their pre-pandemic peaks. This macro trend puts immense pressure on individual lenders to understand their micro-trends.

Imagine your lending portfolio has 10,000 active accounts in the 30 DPD bucket this month. A typical 30- to 60-day DPD roll rate might be 25%. That means you can expect 2,500 of those accounts to become 60-day delinquent accounts next month.

Now, what if that roll rate creeps up to 30%?

That’s an additional 500 accounts rolling into a more severe stage of delinquency. For example, the average balance is $15,000; that’s an extra $7.5 million in portfolio value that has just moved significantly closer to becoming a charge-off. This isn’t just a number on a report; it triggers a cascade of consequences:

  • Increased Loss Provisioning: Your allowance for credit losses (ACL) needs to be adjusted upwards, directly impacting profitability.
  • Strained Collections Resources: Your collections team now has to manage a larger pool of higher-risk accounts, which stretches their capacity and reduces their effectiveness on a per-account basis.
  • Inaccurate Forecasting: If you don’t understand the drivers behind this increase, your models for predicting future losses will be unreliable, creating uncertainty for capital planning and strategy.

The core challenge is that the cause is rarely simple. It’s not just “FICO scores below 620.” It’s a combination of factors. Perhaps they are loans originated through a specific channel in a certain geography, combined with a particular payment method, and a recent lull in collections outreach. Identifying these multi-dimensional drivers is where traditional roll rate analysis tools often struggle.

The True Cost of ‘Good Enough’: A Deep Dive into Traditional Roll Rate Analysis

When a critical KPI, such as the 30-to-60 DPD roll rates, suddenly jumps, the clock starts ticking. Every day that passes without a clear answer is a day when the problem worsens and becomes more expensive. Let’s create a realistic example to illustrate the challenges and quantify the costs.

The Scenario:

You are the Chief Risk Officer at a subprime auto lender with a $1 billion portfolio. Your 30 DPD bucket typically holds around $80 million in active loans. Your analytics capabilities are lean but competent: you have one sharp BI Analyst who is a wizard with Tableau, and one Data Analyst who handles more complex SQL queries and reporting.

This month, the 30-to-60 DPD roll rate jumps from its historical average of 22% to 25%. This 3-point increase means an additional $2.4 million ($80M * 3%) has just rolled into a more severe delinquency stage than expected. You need answers, fast. Here is what would unfold using traditional methods.

Phase 1: The BI Analyst’s Marathon with Tableau or Their Favorite BI Tool

The first call goes to your BI Analyst. Their mission is to use the company’s interactive dashboards to find the source of the bleeding.

The Process:

  1. Initial Triage (Day 1): The analyst opens the primary Risk Dashboard. The roll-rate metric is red. They begin the standard “slice and dice” routine, applying filters one by one to see if any single dimension stands out. They methodically work through the list:
    • Loan Vintage (Are newer loans worse?)
    • Geographic Region / State
    • Product Type (e.g., Direct vs. Indirect)
    • Original FICO Score Band
    • Original LTV Band
    • Vehicle Type 
    • Top 20 Dealer Partners
    • Income Level Bands
    • Payment Method (Auto-debit vs. Manual)
  2. Chasing Ghosts (Days 2-4): After a day of work, the analyst finds a few potential leads. The roll rates appear to be higher in Texas, particularly for loans with an LTV ratio exceeding 120%. But these are broad categories containing thousands of loans. It’s a clue, but it’s not actionable. To dig deeper, the analyst must now test for interactions. This is where BI tools start to become incredibly cumbersome.
    • To test “Texas AND LTV > 120%,” they have to create custom groups or calculated fields.
    • To test “Texas AND LTV > 120% AND from an Independent Dealer,” it’s another layer of manual filtering.
    • Each new hypothesis requires manually manipulating the dashboard, waiting for it to reload, and visually inspecting the results. Testing just 20 or 30 of the thousands of possible combinations is a tedious, multi-day affair.
  3. Inconclusive Findings (Day 5): After a whole week, the analyst prepares a report. They can confidently say that performance is worse in Texas and among high-LTV loans, but they can’t determine a specific, high-impact segment. They haven’t found the “smoking gun” because it’s not a single factor; it’s a complex combination of five or six factors that their manual method could never realistically uncover.

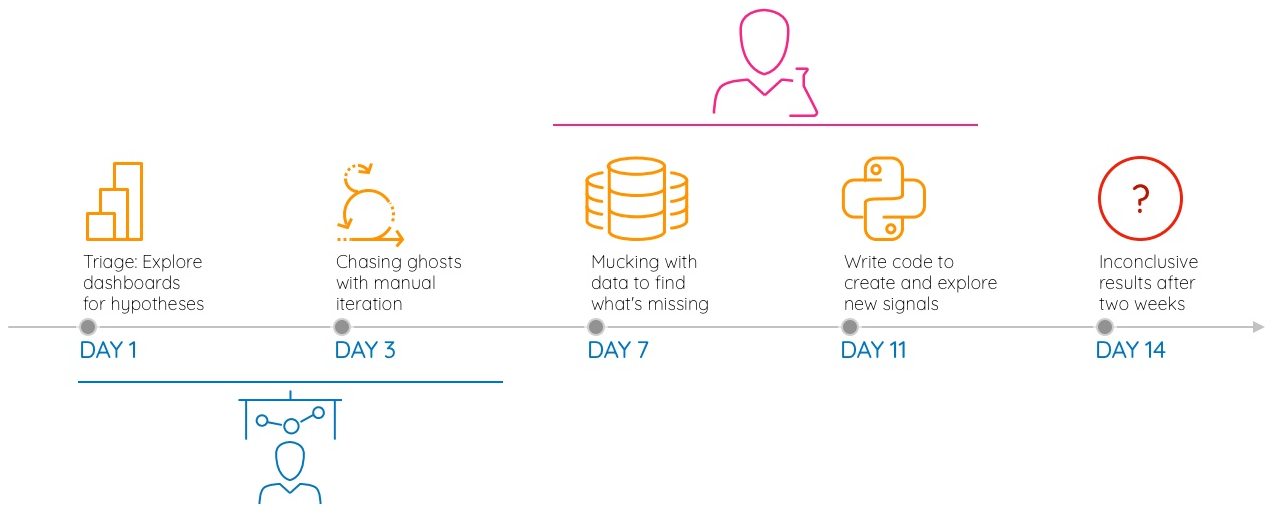
Quantifying the Cost of Phase 1:

  • Time & Personnel Cost: The investigation has consumed five business days of a skilled analyst’s time. A fully loaded salary for an experienced BI Analyst can be $120,000 per year, or approximately $480 per day. That’s a direct operational cost of $2,400. However, this pales in comparison to the opportunity cost.
  • Cost of Delay (Possible Losses): During the analyst’s work, a week had passed. The extra $2.4 million that rolled to 60 DPD is now a week closer to becoming a 90 DPD charge-off. More importantly, you have no new strategy to prevent next week‘s cohort of 30 DPD borrowers from doing the same thing. The credit risk continues to grow daily because your intervention strategy remains unchanged. You are losing the battle against time.

Phase 2: The Data Analyst’s Bottleneck with SQL/Python

Unsatisfied with the BI findings, you escalate the request to your Data Analyst, the only person who can write code to query the production databases directly.

The Process:

  1. Data Wrangling (Days 6-9): This is the “data janitor” work that notoriously consumes up to 80% of any analyst’s time. Before any analysis can begin, they must:
    • Write complex SQL queries to JOIN tables from different systems: the loan origination platform, the core servicing system, and the spreadsheet where collections call logs are kept.
    • Clean the data. They must handle missing LTV values, standardize state abbreviations, deal with different date formats, and filter out inactive accounts. This not only takes a long time to finish but is also tedious and fraught with potential errors.
  2. Manual Discovery (Days 10-12): The raw historical data alone is insufficient. The analyst must use domain knowledge to discover new, more meaningful signals. This involves writing more code (SQL or Python scripts) to perform calculations like:
    • days_from_payment_due_to_actual_payment
    • borrower_age_at_origination
    • payment_to_income_ratio
    • number_of_collection_calls_in_last_30_days
    • This is a highly manual process guided by the analyst’s hypotheses. They might create 20 or 30 new signals, but they are limited by the time and imagination available.
  3. Analysis and Reporting (Days 13-14): With the data finally prepared, the analyst can run queries to test correlations between their newly engineered signals and the roll rates. Assume they might find a few interesting patterns, but like the BI analyst, they are still limited to testing a small subset of possibilities. They prepare a more detailed report and present it at the end of the third week.

Quantifying the Cost of Phase 2:

  • Time and Personnel Cost: This deeper dive has taken an additional nine business days. A Data Analyst/Scientist can have a fully loaded cost of $180,000/year, or about $720 per day. This phase cost $6,480 in salary. The total personnel cost for the investigation is now nearly $9,000.
  • Cost of Delay (Possible Losses): Nearly three weeks have passed since the problem was identified. The initial $2.4 million in at-risk loans is now approaching 90 DPD, where the probability of loss is dramatically higher. Furthermore, two more weekly cohorts have passed through the 30 DPD bucket, likely with the same poor roll rate performance, adding more to the high-risk pool. Your team has been employing the same ineffective collection strategies for this entire time, wasting on low-risk accounts while failing to apply sufficient pressure to the unidentified high-risk segments. Under these circumstances, the cost of this delay is no longer theoretical; it’s beginning to materialize as real, preventable losses.

The Hidden Cost: Rigidity of Vertical Platforms

Throughout this process, you’ve also checked your Loan Management System’s (LMS) built-in analytics module. It provided the initial alert but offers no path forward. It’s canned reports on vintage performance and risk grades confirmed the problem, but couldn’t explain it. The LMS cannot ingest and analyze data from alternative vendors or other non-standard sources. This isn’t a cost of time, but a cost of strategic paralysis. You are locked into your vendor’s predefined view of risk, unable to adapt or investigate emerging threats that fall outside their standard reports.

A New Paradigm: Uncovering Hidden Drivers with Statistical AI

To get ahead of the delinquency snowball, you need to be both deep and fast. This requires a new approach that automates the discovery process, empowering business experts to find answers without writing a single line of code. This is the power of Statistical AI.

At dotData, we’ve engineered our dotData Insight platform around this concept. Statistical AI applies machine learning not for prediction, but for discovery. It acts as an automated data analyst, sifting through all your raw data to find the hidden signals—the “business drivers”—that have the most significant impact on your KPIs.

Imagine you want to understand why your 30-to-60 DPD roll rate has increased. Here’s how the process changes with Statistical AI:

  1. Connect Your Data: You connect dotData Insight to your various types and sources of data, including your loan servicing platform, origination data, spreadsheets with dealer information, collections activity logs, and more. There’s no need to spend weeks building a perfect, unified data warehouse.
  2. Define Your Goal: Simply point the platform at your target —the 30-to-60 DPD roll rate.
  3. Automate Discovery: The system takes over. It explores every possible combination of tables, columns, and patterns in your data. It automatically generates millions of potential signals and hypotheses—far beyond what any human team could achieve. It looks for interactions like “the original LTV combined with the payment method” or “the time since the last collections contact for loans originated in a specific region.”
  4. Surface What Matters: Instead of a dashboard with millions of data points, the platform delivers a concise, prioritized list of the most potent business drivers, written in plain English.

Suddenly, the “why” becomes crystal clear. You might discover drivers like:

  • Driver 1: For accounts where the Borrower’s State is Texas, the roll rate to 60 DPD is 42%. This group represents 12% of all your 30 DPD accounts.
  • Driver 2: For accounts where the Original LTV is > 125%, the roll rate is 38%. This group makes up 20% of your 30 DPD accounts.
    • Insight: This is a result of Magic Threshold Discovery, where the AI tested all possible LTV values and found that 125% was the most critical cutoff point for this KPI.
  • Driver 3: For accounts where the Payment Method is Manual ACH, the roll rate is 35%. This applies to 25% of your 30 DPD accounts.
  • Driver 4: For accounts where the last payment was made > 5 days after its due date, the roll rate is 40%.
    • Insight: Again, Magic Threshold Discovery pinpointed the 5-day mark as the most significant signal of risk, saving you from having to guess or measure manually.

From Insight to Action: Building Data-Driven Micro-Segments

Discovering these individual drivers or factors is the first step. The real value comes when a business user—a risk manager or collections director with deep domain knowledge—can interactively combine them to build powerful micro-segments without writing any code.

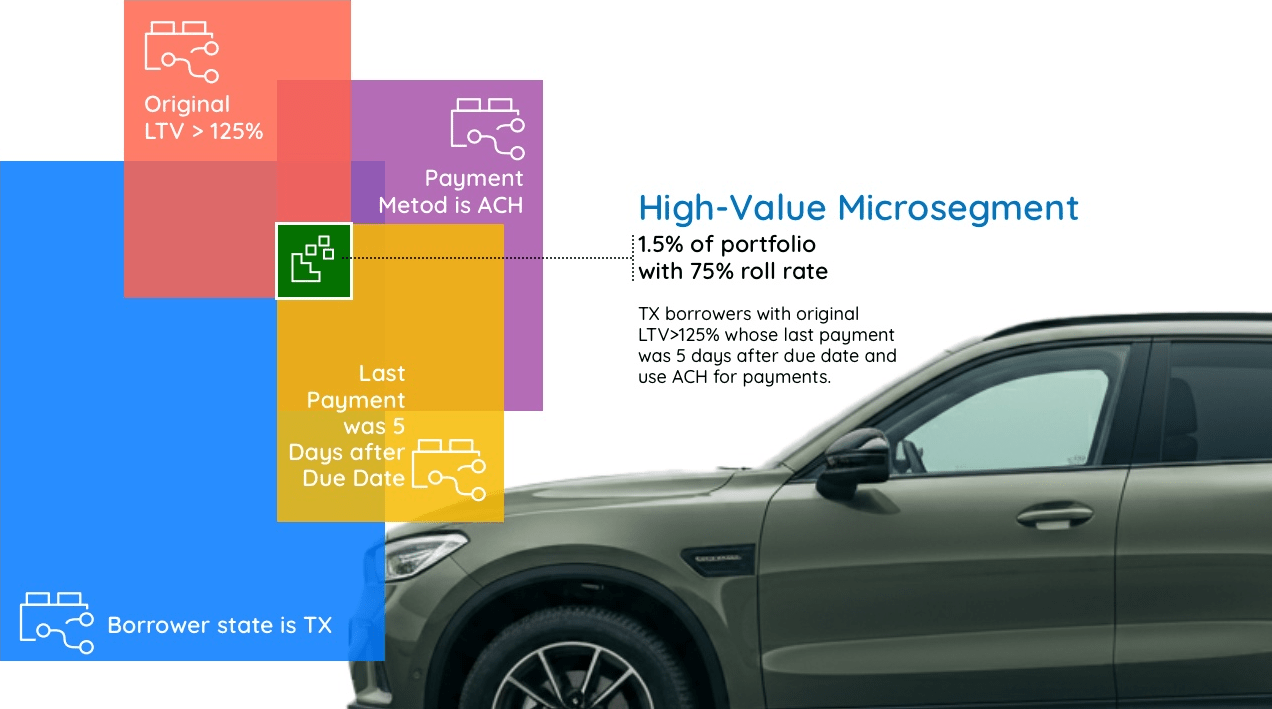
This is where you move from analysis to action. Using dotData Insight, the manager can start by selecting the most potent single driver from the list: Borrower’s State is Texas. The system instantly shows this segment has a 42% roll rate.

This isn’t deep enough. So, they add (or “stack”) a second driver on top of it: Original LTV is > 125%.

The platform recalculates in real-time. This new, combined segment of Texas borrowers with an LTV over 125% is smaller, but their roll rate has jumped to 55%. They are getting closer to the core of the problem.

Let’s add a third driver: Payment Method is Manual ACH.

Again, the system instantly recalculates. This hyper-targeted micro-segment may only represent 1.5% of your 30-day DPD portfolio, but its roll rate is a staggering 75%.

This is the actionable insight that was impossible to find with traditional methods. It’s no longer a vague problem; it’s a specific, identifiable group of borrowers who need a completely different collections strategy, and they need it now. This group warrants:

  • An immediate outbound call from a senior collections specialist.
  • An automated SMS with a direct link to a payment assistance form.
  • Exclusion from standard letter campaigns and enrollment in a high-intensity workout program.

This is how lean, agile lenders can outperform the competition. While others are spending weeks trying to diagnose a problem, you can identify, isolate, and act on your highest-risk segments in a matter of hours.

Stop Reacting, Start Anticipating: The ROI of Speed

The subprime lending environment will only become more complex, especially during economic downturns. Relying on an analytics playbook from the last decade is no longer a viable strategy for managing risk in the modern world. The actual cost of traditional methods isn’t just the salary of your analysts; it’s the millions in preventable losses that accumulate while you wait for answers.

Let’s revisit the math. The traditional, three-week investigation cost nearly $10,000 in direct personnel costs. If a similar deep dive is needed every month, you’re spending over $120,000 a year just to keep your head above water on this single issue, while your most valuable analysts are trapped in a cycle of reactive fire-fighting.

The real damage is in the delayed action. During those three weeks, you failed to treat an additional $2.4 million in high-risk loans effectively. A targeted, timely collections strategy could reduce the ultimate charge-off rate on this toxic segment by 20 percentage points. The cost of your delay—the failure to act—is a likelihood of $480,000 ($2.4M * 20%) in preventable losses, from a single monthly cohort.

Now, compared to the dotData approach, an AI-powered discovery platform can deliver the key drivers and micro-segments in under a day. Your team can move immediately to design and implement a targeted strategy, engaging that $2.4 million cohort while there is still time to influence outcomes.

Even with an annual subscription fee, the ROI is overwhelming. Preventing that single $480,000 loss from one month’s analysis more than pays for the platform for the entire year. More importantly, it frees your expert team from the drudgery of manual data work, allowing them to focus on what they do best: building strategies that protect the portfolio and drive the business forward.

The choice is clear. You can continue to pay the high price of being slow, or you can invest in the speed and depth needed to win. Stop reacting to the delinquency snowball. Start anticipating it by deploying your resources with precision that protects your portfolio and secures your bottom line.

Ready to see the hidden drivers impacting your roll rates? Learn how dotData Insight can provide the clarity you need to act decisively.

Bart Blackburn, Ph.D.

With a PhD in Statistics and experience as a two-time founder, Bart brings deep data science expertise to his role as a Staff Data Scientist and Field Product Manager. He focuses on applying advanced machine learning to solve complex business challenges and deliver actionable insights for dotData's clients. His entrepreneurial background includes co-founding Priceflow, an ML-powered auto-pricing company acquired by TrueCar.

dotData's AI Platform

dotData Feature Factory Boosting ML Accuracy through Feature Discovery

dotData Feature Factory provides data scientists to develop curated features by turning data processing know-how into reusable assets. It enables the discovery of hidden patterns in data through algorithms within a feature space built around data, improving the speed and efficiency of feature discovery while enhancing reusability, reproducibility, collaboration among experts, and the quality and transparency of the process. dotData Feature Factory strengthens all data applications, including machine learning model predictions, data visualization through business intelligence (BI), and marketing automation.

dotData Insight Unlocking Hidden Patterns

dotData Insight is an innovative data analysis platform designed for business teams to identify high-value hyper-targeted data segments with ease. It provides dotData's hidden patterns through an intuitive, approachable interface. Through the powerful combination of AI-driven data analysis and GenAI, Insight discovers actionable business drivers that impact your most critical key performance indicators (KPIs). This convergence allows business teams to intuitively understand data insights, develop new business ideas, and more effectively plan and execute strategies.