Why Most Credit Decisioning Evaluations Fail

  • Industry Use Cases

Auto loan balances reached $1.69 trillion in Q1 2026, and lenders originated $182.1 billion in new paper in that quarter alone. Each of those originations was priced by a system somebody bought.

Yet, when auto lending risk leaders set out to modernize their risk architecture, the evaluation process itself is often broken from the start.

Most evaluation matrices place four fundamentally different products into a single comparison, apply the same criteria to all of them, and produce a ranking that means nothing. To address this, we created a new interactive resource to help you cut through the noise in your procurement process.

The Problem: One Label, Four Purchases

How do you fix a broken evaluation process? Stop comparing origination fraud filters, decisioning engines, BI dashboards, and Signal Intelligence platforms. They’re often pitched and reviewed under a single category name, but they solve entirely different problems.
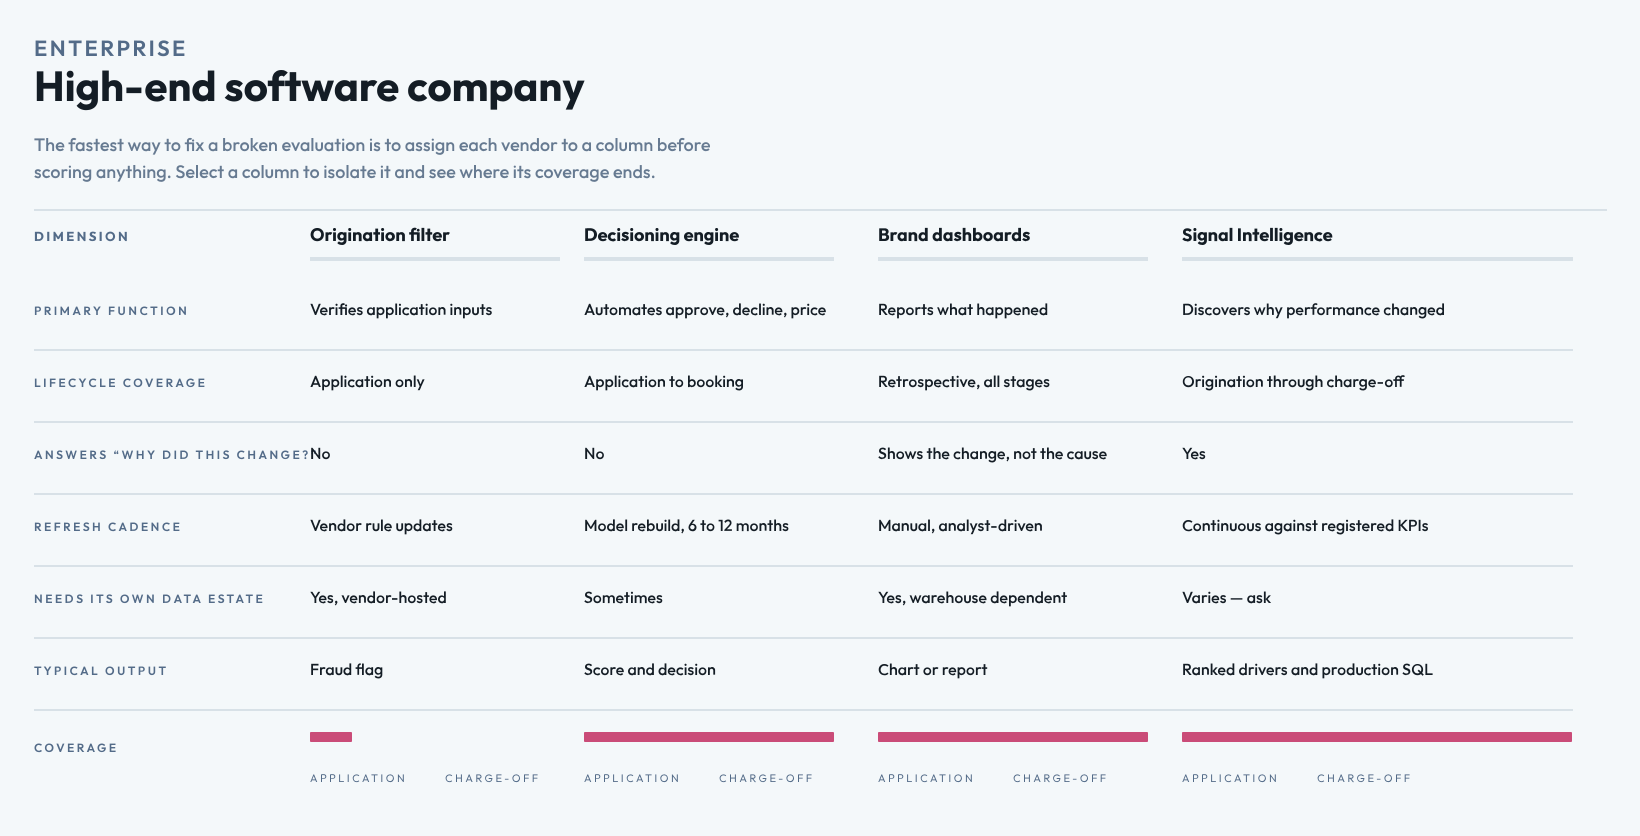
A decisioning engine optimizes a model against a portfolio-level objective—automating the approve, decline, and price decisions. It has no mechanism to explain why a segment within that portfolio began deteriorating. Explaining deterioration is not an optimization problem.

Conversely, BI dashboards make deterioration visible, but they cannot identify the combination of variables that produced it. This leaves your data science team with a multi-week manual investigation. Scoring a BI dashboard against a decisioning engine produces a winner by accident. Our guide helps you assign each vendor to their proper column before you score anything.

Hidden Risks in the Modern Portfolio

Standard demonstrations fail to capture the realities of the modern auto lending market. A vendor demonstration built on portfolio-wide averages is running on data where populations cancel each other out.

Consider the realities risk teams are facing today:
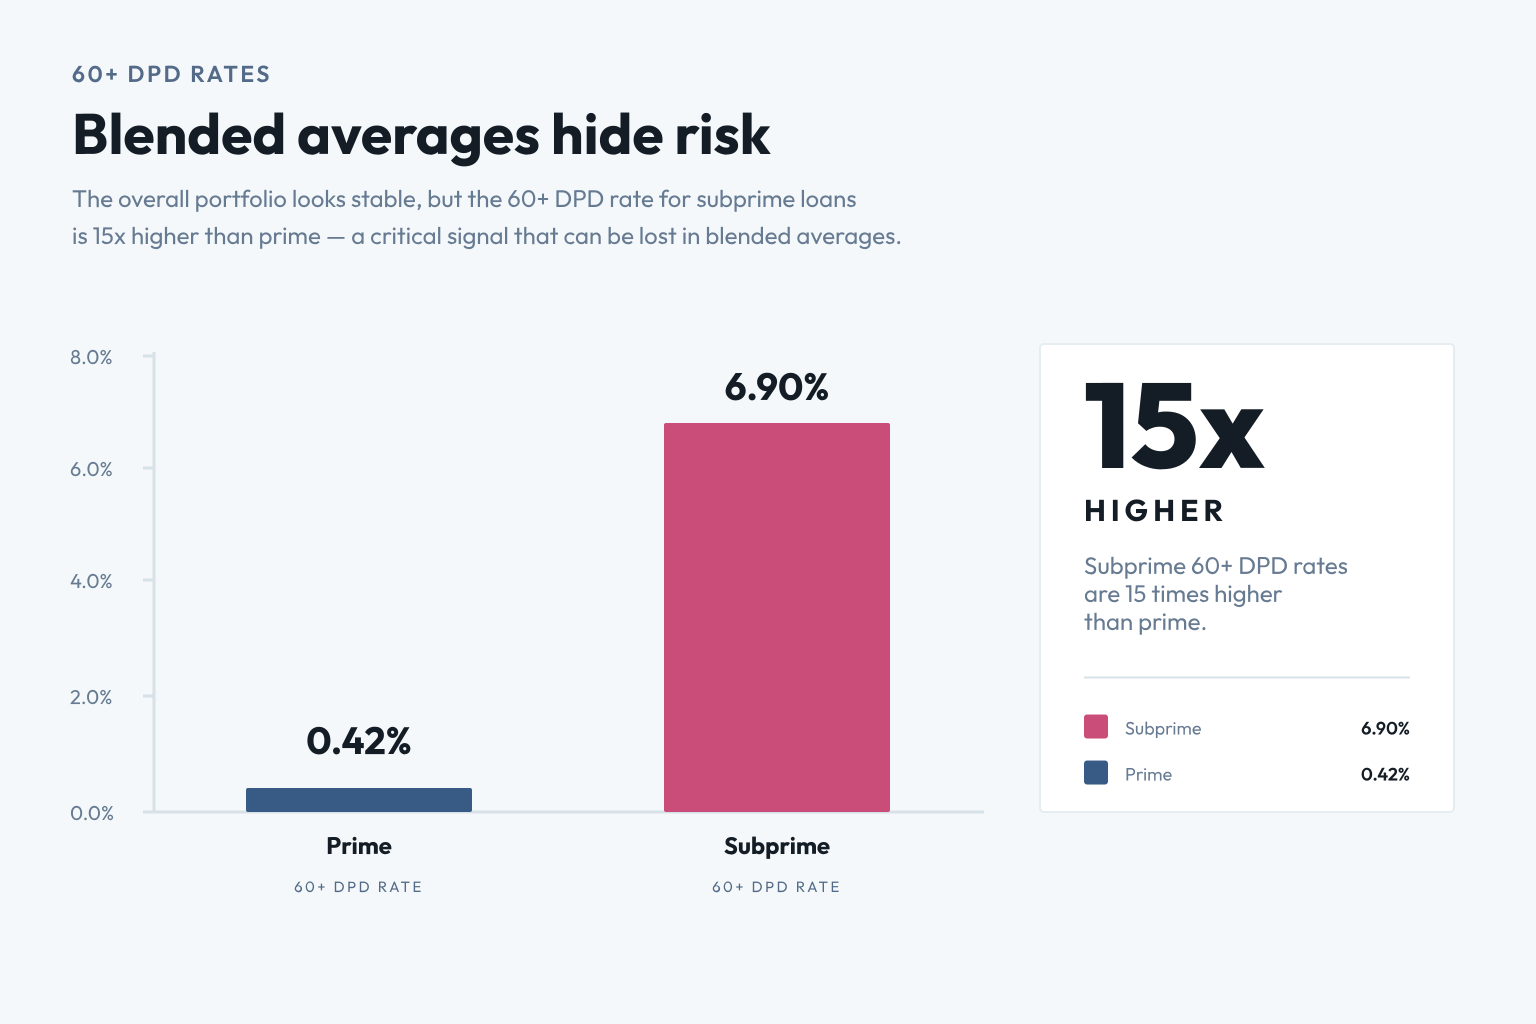
  • Blended averages hide risk: Prime 60+ DPD sits at 0.42% while subprime hit 6.90% in January 2026—a record in an index dating to the early 1990s.
  • The obligation moved, not the borrower: Average new-vehicle payments reached $770 in Q1 2026, with nearly 19% of new-vehicle loans carrying a payment of $1,000 or more. A system that cannot construct payment-to-cash-flow relationships from raw relational data is accurately scoring the wrong metrics.
  • Loss severity is set at origination: In Q2 2026, 29.6% of new-vehicle trade-ins carried negative equity, with an average deficit of $6,884. Loss severity is fixed months before the account appears in a delinquency report.

The 12 Questions That Decide It

When evaluating vendors, standard questionnaires often consist of baseline hygiene checks. In our buyer’s guide, we’ve isolated the 12 critical questions where a weak answer is diagnostic, not just disappointing.

These are the questions you need to ask live, where a marketing team can’t edit the answers. For example:
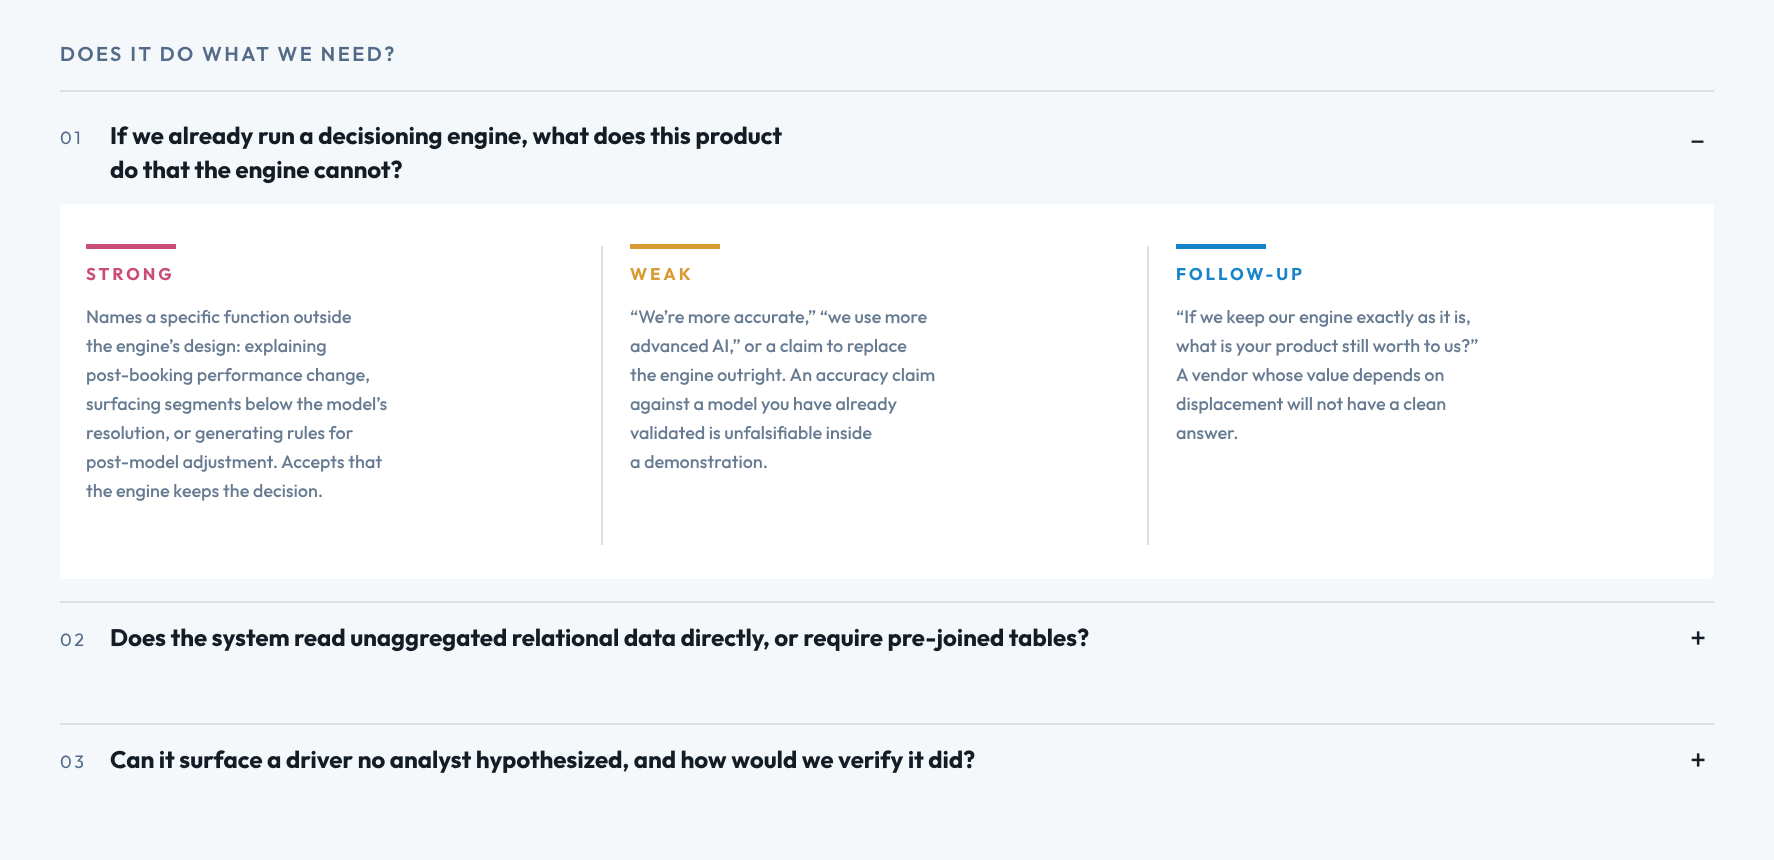
  • Does the platform read raw relational tables, or require pre-flattening? If a vendor says, “We work with your existing warehouse tables,” that often means your analysts do the joining—relocating the work rather than removing it.
  • Can we defend the output? Does the software produce reasons tied to identifiable attributes at the individual decision level, in language that maps onto an adverse action notice? Or does it offer SHAP values and feature importance charts as if they were the same thing?
  • Is the derivation transparent? Does it emit the derivation itself (SQL, code) so your validation team can recompute a variable independently, or is it a fluent description of a black box?

Fix Your Evaluation Process Today

Before your organization invests in the next phase of its credit decisioning architecture, make sure you’re asking the right questions and evaluating the right categories.

Access our interactive buyer’s guide below and create your own downloadable custom configuration process.


dotData
dotData

dotData Automated Feature Engineering powers our full-cycle data science automation platform to help enterprise organizations accelerate ML and AI projects and deliver more business value by automating the hardest part of the data science and AI process - feature engineering and operationalization. Learn more at dotdata.com, and join us on Twitter and LinkedIn.

dotData's AI Platform

dotData Feature Factory Boosting ML Accuracy through Feature Discovery

dotData Feature Factory provides data scientists to develop curated features by turning data processing know-how into reusable assets. It enables the discovery of hidden patterns in data through algorithms within a feature space built around data, improving the speed and efficiency of feature discovery while enhancing reusability, reproducibility, collaboration among experts, and the quality and transparency of the process. dotData Feature Factory strengthens all data applications, including machine learning model predictions, data visualization through business intelligence (BI), and marketing automation.

dotData Insight Unlocking Hidden Patterns

dotData Insight is an innovative data analysis platform designed for business teams to identify high-value hyper-targeted data segments with ease. It provides dotData's hidden patterns through an intuitive, approachable interface. Through the powerful combination of AI-driven data analysis and GenAI, Insight discovers actionable business drivers that impact your most critical key performance indicators (KPIs). This convergence allows business teams to intuitively understand data insights, develop new business ideas, and more effectively plan and execute strategies.