
AI-based Portfolio Monitoring for Lending: Catching the Drift After the Loan Is Booked
- Industry Use Cases
 dotData
dotData
dotData
A credit score approves a loan the day it is booked, and it begins to age the moment after. The population that score was built on has already shifted — the national FICO average fell for the first time since 2013. The risk exposure that sets this year’s loss line is not in today’s applications; it is in the book a lender already holds.
Many portfolio monitoring systems address the incorrect question using inappropriate financial tools. A fixed 30/60/90-day dashboard indicates that an account has already been down for 60 days — this is accurate, but it’s too late to adjust pricing or make portfolio adjustments. Additionally, industry benchmarks provide minimal value, as a national average does not reveal which specific segment of a lender’s portfolio is gradually declining.
The work that moves the loss curve happens between booking and charge-off. What follows is how post-origination monitoring powered by AI technology catches drift while it is still a pricing or policy decision — on loans already on the books, before the loss is locked in.
AI portfolio analysis for a lending platform involves ongoing analysis of an existing loan portfolio after origination to identify performance shifts — such as scorecard decay, accelerated roll rates, and new risk segments — before they lead to charge-offs. Leveraging artificial intelligence, machine learning algorithms, and predictive analytics, this procedure takes place after approval, focuses on currently active loans, and uncovers market trends that static delinquency dashboards and industry benchmarks often miss.
For many lenders, origination scoring is a primary focus, receiving the board’s attention, the largest share of the budget, and the most vendor evaluations. At the same time, monitoring is often regarded as a “dashboard update” that is refreshed periodically. Deprioritizing monitoring, however, is misguided since an origination score reflects a single moment in time — a snapshot — whereas the loan endures for 60, 72 months, or often longer. Effective AI portfolio management software bridges this gap by turning static reviews into continuous, dynamic oversight.
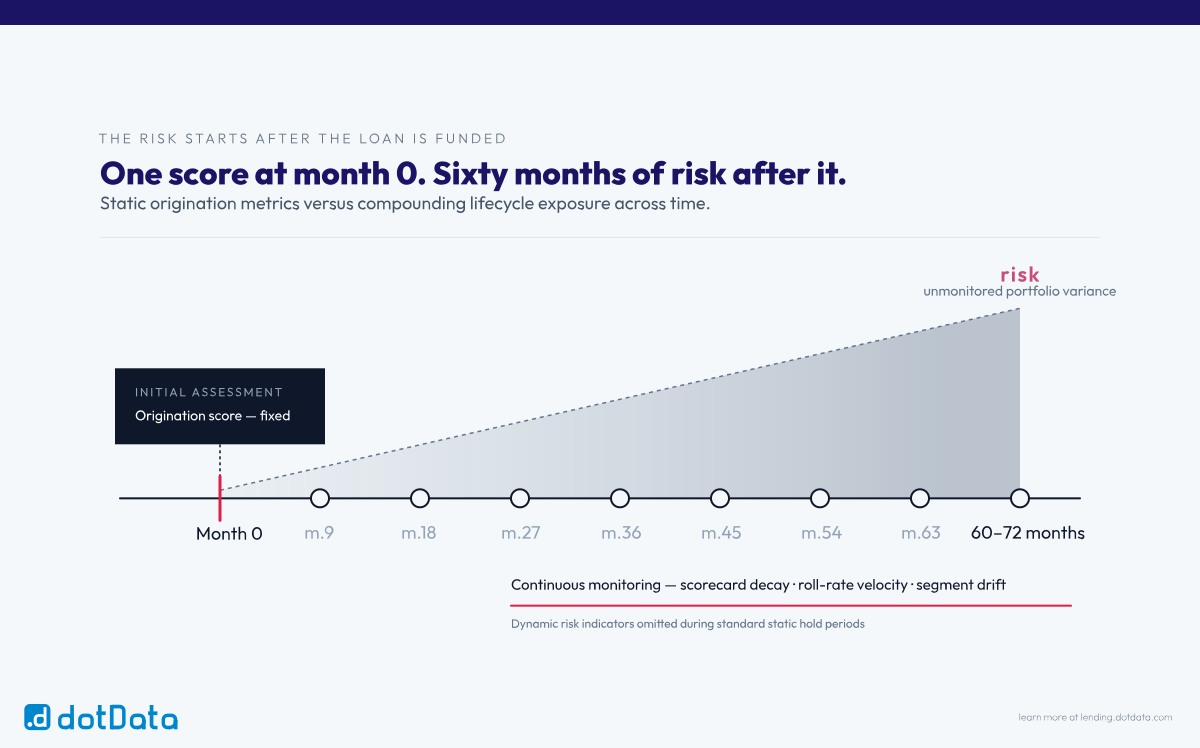
Scorecard decay is the loss of predictive accuracy that sets in when the borrower population, the macro economy, and collateral values shift beneath AI models calibrated at a fixed point. The score assigned at booking is frozen. The risk it was built to predict is not — a model underwritten on a 2021 population misreads a 2025 borrower.
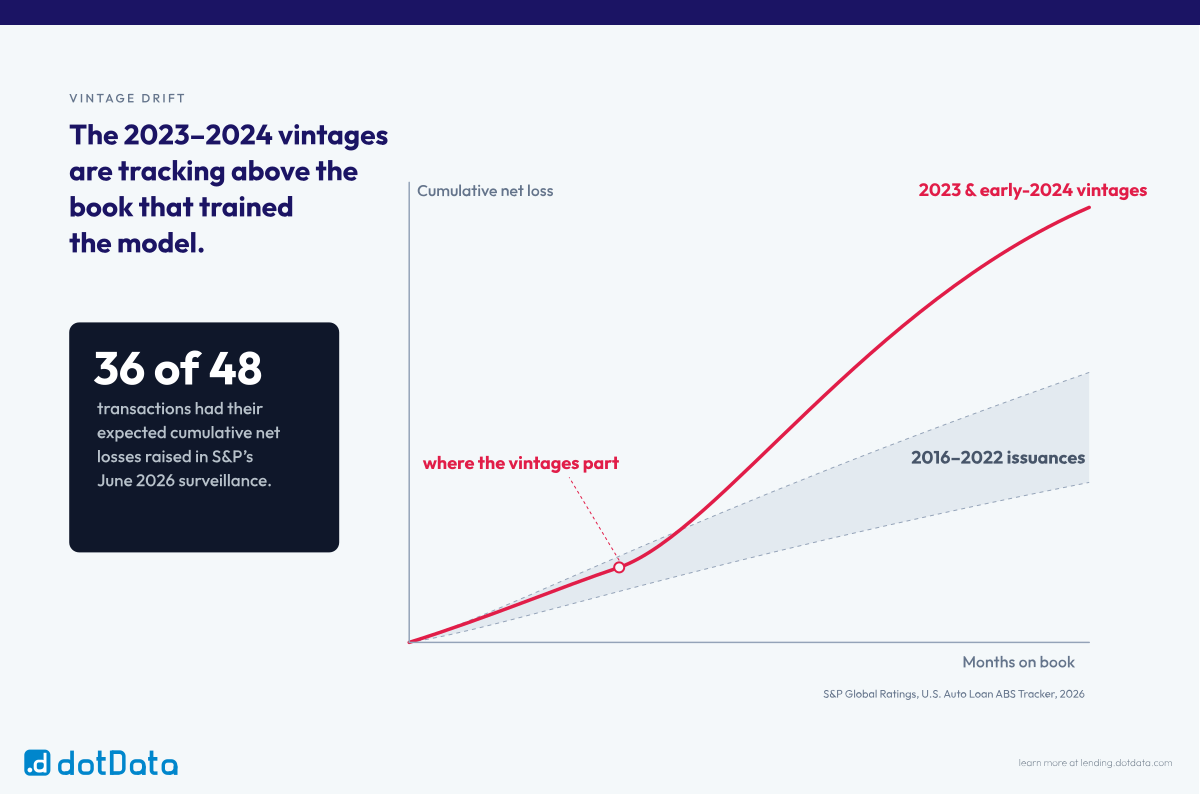
Scorecard decay is a mathematical construct designed to mirror real-world changes. Vintages logged from 2023 to 2025 are underperforming relative to the machine learning models used during the approval process. Agencies evaluating loans for those periods have therefore begun to revise their ratings to reflect those realities.
Begin with the foundation upon which the model is built. The national FICO average has decreased for the first time since 2013, marking a reversal of over ten years of consistent increases — the distribution that every origination scorecard was based on has changed. When this distribution shifts, a static cutoff that was previously effective at booking may inadvertently misclassify the subsequent group. Modern portfolio management software must account for these market shifts through scenario modeling to maintain accurate risk assessment.
The vintages tell the same story from the other end. Prime 2023 and early-2024 auto loans are underperforming the 2016–2022 issuances, and in its June 2026 surveillance, S&P raised expected cumulative net losses on 36 of the 48 transactions it reviewed. Even the quality entering the book slipped — the median new-auto origination FICO score dropped from 724 to 716 in a single quarter.
The static 30/60/90-day delinquency figures provide a retrospective view, while industry averages reflect the overall market rather than the specific portfolio of an individual lender. Neither metric indicates which segments are at risk of increasing losses. In contrast, roll-rate velocity — the speed at which accounts transition between delinquency buckets — serves as a leading indicator and must be assessed within the context of the lender’s own portfolio, rather than relying on national averages.
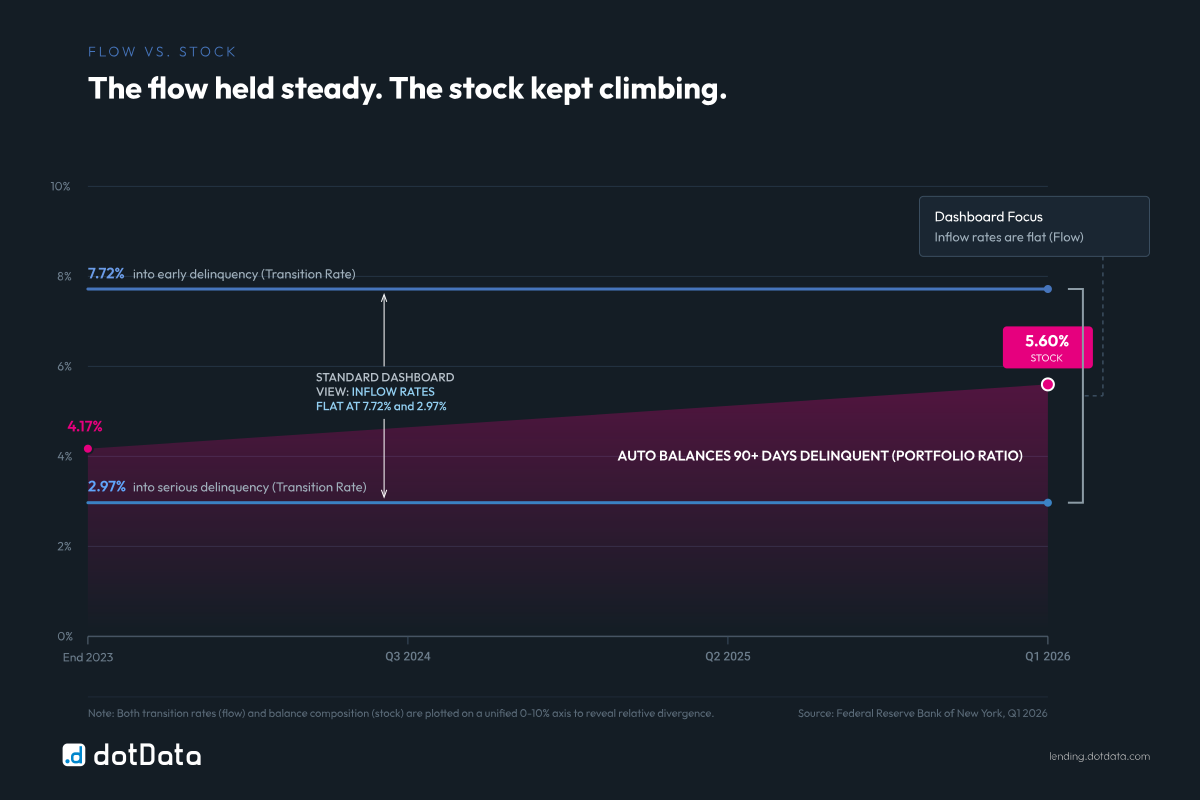
This shows the risk associated with static analysis. The rate at which accounts enter delinquency can remain steady even as the overall amount of severely delinquent balances grows. Accounts already in delinquency are approaching charge-off status, but the dashboard might still show the situation as “under control.” By the time the 60-plus delinquency metric begins to creep up, the effect on loss has already been felt.
The current data shows exactly that split. The NY Fed’s flow into delinquency held roughly steady in early 2026 — 7.72% into early delinquency, 2.97% into serious — while the stock of auto balances 90-plus days past due climbed from 4.17% at the end of 2023 to 5.60% in the first quarter of 2026. Subprime marks the visible edge of the same drift, with 60-plus-day delinquency at a 32-year high, but the mechanism reaches straight up the credit spectrum.
Roll-rate velocity is a distinct discipline, and dotData has already navigated the transition-matrix mechanics involved in Roll Rate Analysis within Auto Lending. The focus for monitoring is more specific: velocity indicates to a lender that the portfolio is active, but does not specify which segment of it.
Signal discovery runs continuously on the booked portfolio, using predictive capabilities to surface the specific, non-obvious variable combinations that drive a KPI — such as the 90-day-past-due rate — that a static scorecard never tested. Instead of watching a portfolio average, AI portfolio monitoring isolates the small, high-lift segment where the drift is concentrated, while there is still time to reprice or knock it out.
Drift is never spread evenly across a book. It hides in a slice too small to move the portfolio average and too specific for a standing scorecard to have flagged — which is exactly why the average keeps reading fine.
This is the job dotData Core does on the loans a lender has already booked. Rather than asking an analyst to perform manual work, it relies on AI analysis to process vast amounts of financial data and evaluate millions of relational combinations directly against the target KPI. It eliminates time-consuming manual data entry and surfaces Driver Signals — named, measurable patterns with a lift figure attached that offer an objective analysis.
The benefits of monitoring are revealed when signals converge. A secured credit card Driver Signal, representing 4.93% of records, elevates the 90-day past-due rate from a 20% baseline to 39.3%, while an education loan signal, covering 5.84%, raises it to 25.6%. When these are aggregated into a single Precision Impact Segment, the 0.443% of the portfolio that satisfies both conditions shows a default rate of 50.0%. This notable 30-percentage-point rise has no impact on the portfolio average.
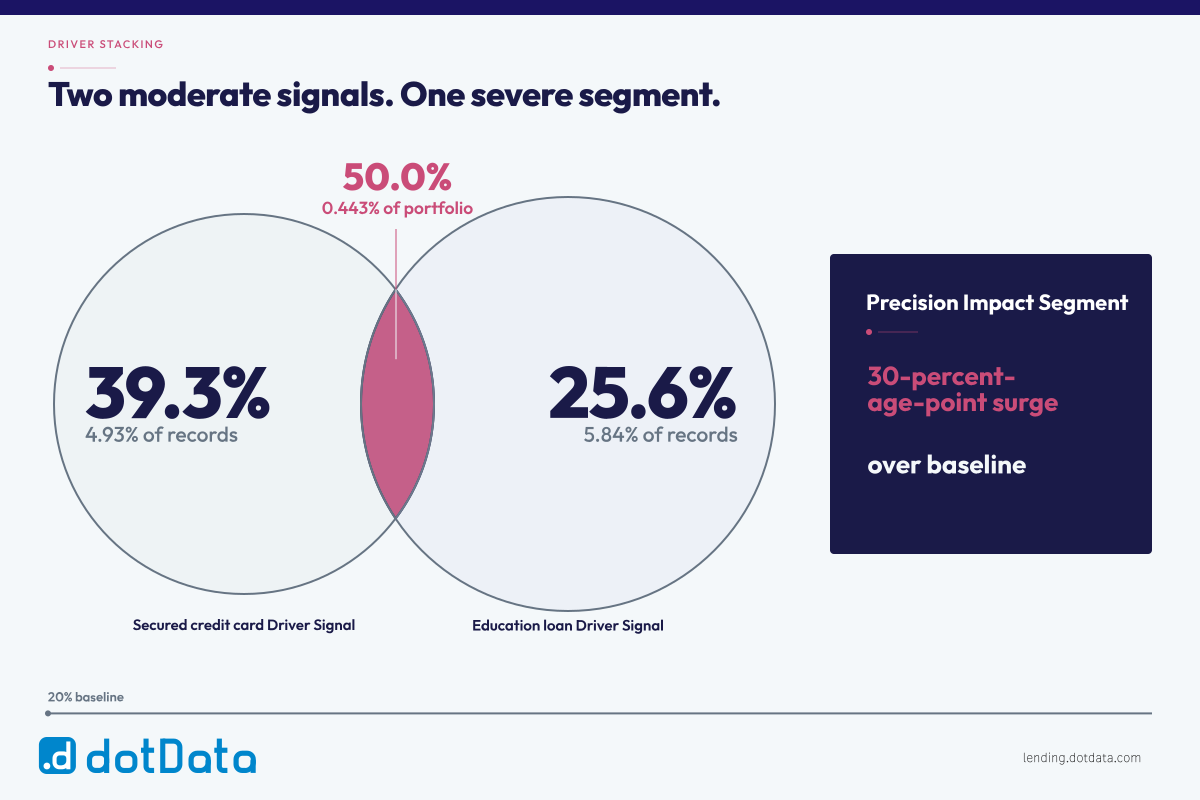
Signal discovery technology is not a replacement for your decision stack, but works in the background using existing workflows and existing systems to guide pricing, knockout rules, and collections decisions without requiring a total overhaul. A segment constituting 4% of the portfolio, with a default rate 250% higher than the baseline, does not warrant an expensive model-retraining initiative. Still, it does compel a repricing or portfolio action for the quarter to prevent a charge-off in the following year.
Effective post-origination monitoring improves on what a static dashboard can deliver by assessing roll-rate velocity instead of simply tracking delinquency levels. Post-origination monitoring also categorizes the portfolio to identify drifting segments, rather than just monitoring an average. Finally, post-origination monitoring clarifies the reasons behind the decline of specific segments in terms that both pricing committees and examiners can easily understand.
Most monitoring stacks answer “how much delinquency” and stop there. The two questions that actually move the loss curve are “how fast” and “which segment” — and a levels-only dashboard answers neither. The following are four items that are a must for building post-origination monitoring:
Positioned this way, the dotData Signal Intelligence Platform is the discovery layer feeding the monitoring stack a lender already runs, not a rebuild of it. Portfolio monitoring is a discipline in its own right — the Loan Portfolio Monitoring hub treats it as the pillar it is, and this post serves as the bridge to it from the wider AI in lending cluster.
Approval is a moment; the loan is a multi-year exposure, and the score that approved it begins to decay within the first payment. Lenders who leverage automated portfolio management to monitor for velocity and segment-level drift find the loss while it is still a pricing decision — the ones who watch levels and averages find it in the charge-off report.
As vintages mature and the population shifts, the gap between the portfolio average and what a segment is actually doing can widen. Closing the gap through data-driven decisions is the difference between repricing in the given quarter vs. charging off loans next year.
AI-driven portfolio monitoring for a lending platform involves the ongoing assessment of an existing loan portfolio to identify performance deterioration — such as scorecard decay, accelerated roll rates, and the emergence of high-risk segments — before reaching charge-off. This process occurs post-origination, focusing on loans that are already recorded, and uncovers patterns that static delinquency dashboards and industry benchmarks often overlook.
They monitor for the drift an origination score cannot see: roll-rate velocity between delinquency buckets, vintage curves that track worse than prior originations, and segment-level performance rather than portfolio averages. Signal discovery run on the booked portfolio isolates the specific variable combinations driving the decay, providing deep insights and actionable insights while there is still time to reprice or adjust policy and improve portfolio performance.
See which segment of your booked portfolio is drifting. Talk to dotData about signal discovery for post-origination monitoring.