
A Guide to AI Customer Micro-segmentation
- Technical Posts
You launch a major marketing campaign for a new product, backed by a substantial budget and heightened expectations. The team has done its homework, segmented the customer base into broad, logical categories like “high income earners,” “recent website visitors,” and “loyal clients.” As results begin to arrive, however, there is a sense of disappointment as all key metrics, including lackluster engagement, flat conversion rates, and low Return on Investment (ROI) show that the campaign has failed to resonate, despite the high effort and expectations.
While failure of these marketing efforts can often be attributed to poorly planned product placements or marketing strategies, another problem can frequently be at the root of the failure. The flawed premise that all customers in the large segments created were monolithic. The fault lies in the belief that “high income earners” is a uniform segment, when, in fact, there are several sub-segments, each with unique needs, behaviors, and motivations. The “recent visitor” who spent ten minutes comparing products is fundamentally different from the one who bounced after three seconds, treating such different demographic and behavioral segments as intrinsically equivalent results in a campaign that speaks to everyone, and no one in particular.
In this post, we are going to explore how lenders and eCommerce companies can leverage customer micro-segmentation to intelligently divide customers into exact, granular groups based on a deep, multi-faceted understanding of their behaviors, needs, and characteristics. The objective is to move beyond coarse generalizations and create small, highly homogenous groups that allow for true one-to-one personalization at scale and improve marketing efficiency.
With 71% of consumers expecting companies to deliver highly personalized interactions, hyper-personalization based on micro-segmentation is now a critical component of marketing outreach, with 76% report feeling frustrated when this expectation is not met. This expectation is directly tied to tangible business outcomes. Companies that leverage customer behavioral insights to personalize their outreach outperform their peers by 85% in sales growth and more than 25% in gross margin. Effective personalization can lift revenues by 5 to 15% and increase marketing ROI by 10 to 30%.

Legacy statistical means of segmentation provide value, but are only a starting point for transitioning from mass marketing to a more personalized, tailored customer experience. Statistical approaches have limitations in the depth of insights available, as evidenced by two methods often associated with manual segmentation: rule-based segmentation and statistical clustering.
Rule-based segmentation involves using predefined business rules and logical thresholds to group target clients, leveraging business logic in a process that stakeholders across the organization can easily understand and comprehend. The most prominent and widely used framework for rule-based segmentation is RFM analysis, which evaluates customers based on three simple but powerful dimensions: Recency, Frequency, and Monetary value.
By scoring customers on these three axes, a business can create a clear and actionable segmentation model that enables informed decision-making.
The eCommerce Example: An Online Fashion Retailer
Consider an online retailer seeking to enhance customer engagement and increase repeat purchases. Their analytics team decides to implement an RFM model.

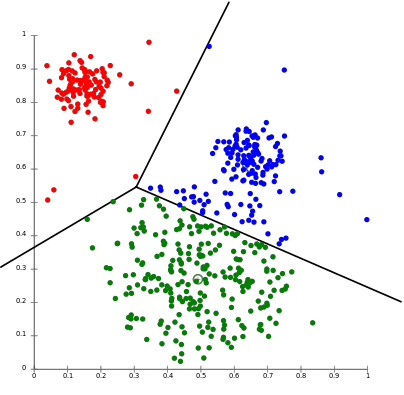
A more mathematically rigorous model for traditional segmentation uses unsupervised machine learning algorithms to group customers based on their similarity across a set of chosen variables. The most common technique for this is the K-Means clustering algorithm. In this method, the analyst selects the input variables and the desired number of clusters (the ‘K’), and the algorithm iteratively partitions the data to find the optimal groupings. Unlike rule-based methods, where the analyst defines precise segments, this algorithm discovers them based on mathematical proximity.
The goal of K-Means segmentation is to minimize the sum of the distances between data points and the center (or “centroid”) of the assigned cluster:
Lending Example: A Consumer Loan Portfolio
An automotive lender aims to refine its credit risk assessment to better understand the nuances within its applicant pool for auto loans. A simple FICO score threshold feels too blunt.
While both previously discussed methods are improvements over simple segmentation, they share a critical limitation in that the analyst’s initial hypothesis constrains them.
Both rule-based and statistical methods share a fundamental limitation: they are constrained by the analyst’s initial hypotheses. These methods are also labor-intensive, slow to implement, and struggle to handle the high dimensionality of modern customer data. More importantly, they can only validate or refine what a business already suspects to be true. The eCommerce analyst chooses to segment by RFM. The risk manager chooses to cluster based on FICO and DTI.
Relying on pre-selected variables can create a “domain bias” where the segmentation is based primarily on organizational knowledge and experience, dictating the questions asked of the data. The answers returned by the analysis, in turn, tend to be framed within the context in which they were asked. For example, “at risk” customers will likely be heavily based on Recency, reinforcing the belief that Recency is the most critical measure of churn. This feedback loop prevents true discovery by confirming or slightly adjusting the company’s existing worldview, but not fundamentally challenging it by introducing a completely unexpected driver of behavior.
The reliance of traditional segmentation methods on human hypotheses and the difficulty in scaling across large, complex data sets require a new approach that is driven by the data itself. By utilizing Artificial Intelligence (AI), analysts can harness the power of machine learning to automatically sift through raw data, uncovering hidden signals that are strong indicators of business outcomes. The shift to AI represents a move from hypothesis-driven analysis to true data-driven discovery.
To understand the practical impact of this shift, consider the challenge faced by a data scientist at a modern automotive lender.
Anjali is a lead data scientist at a fast-growing automotive lender. Her team has developed a robust credit risk model that performs well, built on standard application data (income, employment status) and credit bureau information (FICO score, credit history). However, a troubling anomaly has emerged: a small but financially significant number of customers within their “prime” segment—those with high FICO scores and solid incomes—are defaulting on their loans unexpectedly. The existing features in her model cannot explain this behavior. Anjali knows the answer is likely buried in the terabytes of raw customer bank transaction data the company possesses, but the sheer volume and complexity make manual exploration impossible. There are an infinite number of potential combinations of behavioral signals, and her team lacks the time and resources to test even a fraction of them.
Anjali turns to dotData Feature Factory, an AI-powered platform explicitly designed to address this challenge. She connects the platform to her company’s raw data sources, including the loan application database, credit bureau reports, and, crucially, the raw bank transaction data. Instead of Anjali having to write hundreds of complex SQL queries to test hypotheses, such as “does spending velocity increase before a default?”, dotData Feature Factory takes over. It autonomously explores the relationships between tables and across time, automatically generating hundreds of thousands of new, potentially predictive features.
The platform goes far beyond simple aggregations. It uncovers multi-step behavioral patterns and temporal trends in customer journey, creating sophisticated features that a human analyst would likely never conceive of, such as:
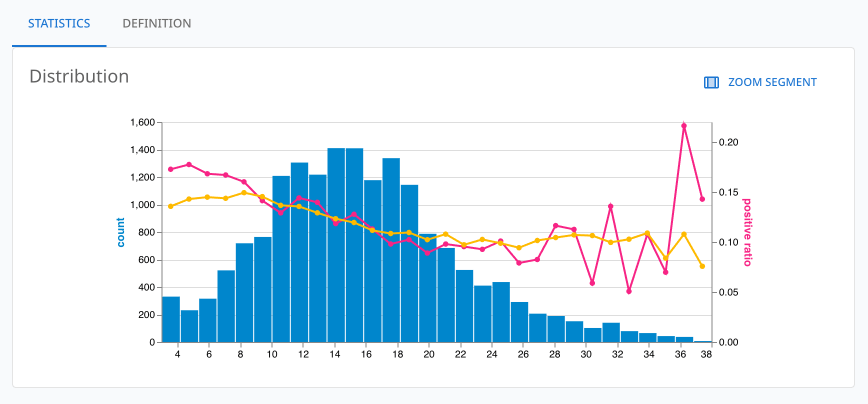
After the AI engine has explored the data, Anjali uses dotData Feature Factory’s interactive feature selector to identify the most potent new signals. The platform presents a clear and compelling visualization: a plot comparing the predictive power of her original model with a new model enhanced by AI-discovered features.
When comparing the plot lines of the old and new models, Anjali discovers a significant “gap” between the legacy, manual model and the dotData Feature Factory-based one. The gap between the two lines is a critical new risk profile of defaulting “prime” customers, visible for the first time.
Drilling down, Anjali discovered that the single most predictive new feature was the increase in the frequency of small-dollar cash advances in the two weeks before the loan application. This was a subtle but powerful signal of short-term financial distress that was completely invisible in the high-level credit bureau data. Armed with new insights, Anjali can now build a more accurate risk model, incorporating a new micro-segment of “high volatility prime” customers who require a distinct underwriting approach.
This process fundamentally transforms the role of the data scientist. In the traditional workflow, a data scientist spends up to 80% of their time on laborious data preparation and manual feature engineering—acting as a “feature artisan” who carefully crafts a few features by hand. An automated platform like dotData Feature Factory handles this entire process, generating hundreds of thousands of features in a fraction of the time. The data scientist’s job is no longer to create the features but to evaluate, select, and interpret the most powerful ones generated by the AI. They evolve into a “portfolio manager of insights,” analyzing a wide array of AI-generated assets (the features) and selecting the ones that provide the best “return” (predictive lift) for a given business problem. This shift offers a significant increase in strategic leverage, enabling a single data scientist to oversee the improvement of multiple models simultaneously, thereby scaling the impact of the data science function across the entire organization. And the boost to Anjali and her team isn’t just speed and productivity; the data-driven approach surfaces statistically significant signals that were previously unknown and unsought. Anjali and her team can focus on utilizing their domain expertise to perform last-mile feature selection on the insights discovered and engineered by dotData Feature Factory.
Uncovering a hidden, predictive pattern is a significant breakthrough, but it is only half the battle. Extracting value from discovered insights comes down to putting them into action as business decisions. The “last mile” problem of analytics is bridging the gap between the complexity of data science and the practical requirements of business users. Compelling insights must be accessible, understandable, and actionable for non-technical users who drive the business, requiring a new class of tools to democratize AI-powered discoveries.
Let’s shift our focus from the data scientist’s challenge to that of a marketing leader who needs to act on data to drive growth.
Ben is a Senior Marketing Manager at a large eCommerce marketplace. The company is preparing to launch a new premium subscription service that offers benefits like free two-day shipping and exclusive access to deals. Ben’s marketing budget is limited, and he knows that a broad, site-wide promotional blast would be wasteful and ineffective. His goal is to identify specific micro-segments of existing customers who are most likely to see the value in the service and convert. He has strong business intuition—he suspects that frequent shoppers who are sensitive to shipping costs are the right target—but he doesn’t have the technical skills to query the database himself. The data science team, busy with risk and fraud models, has a six-week backlog for new marketing requests. This is a classic organizational bottleneck where valuable business initiatives are stalled due to a lack of self-service analytics capabilities.
Ben logs into dotData Insight, an intuitive, visual platform designed for business users. The platform is built on top of the powerful, AI-generated feature library created by dotData Feature Factory, but it abstracts away the complexity. Instead of code, Ben interacts with a visual interface where he can build different micro segments by combining business drivers in plain English.
His process of discovery is interactive and immediate:
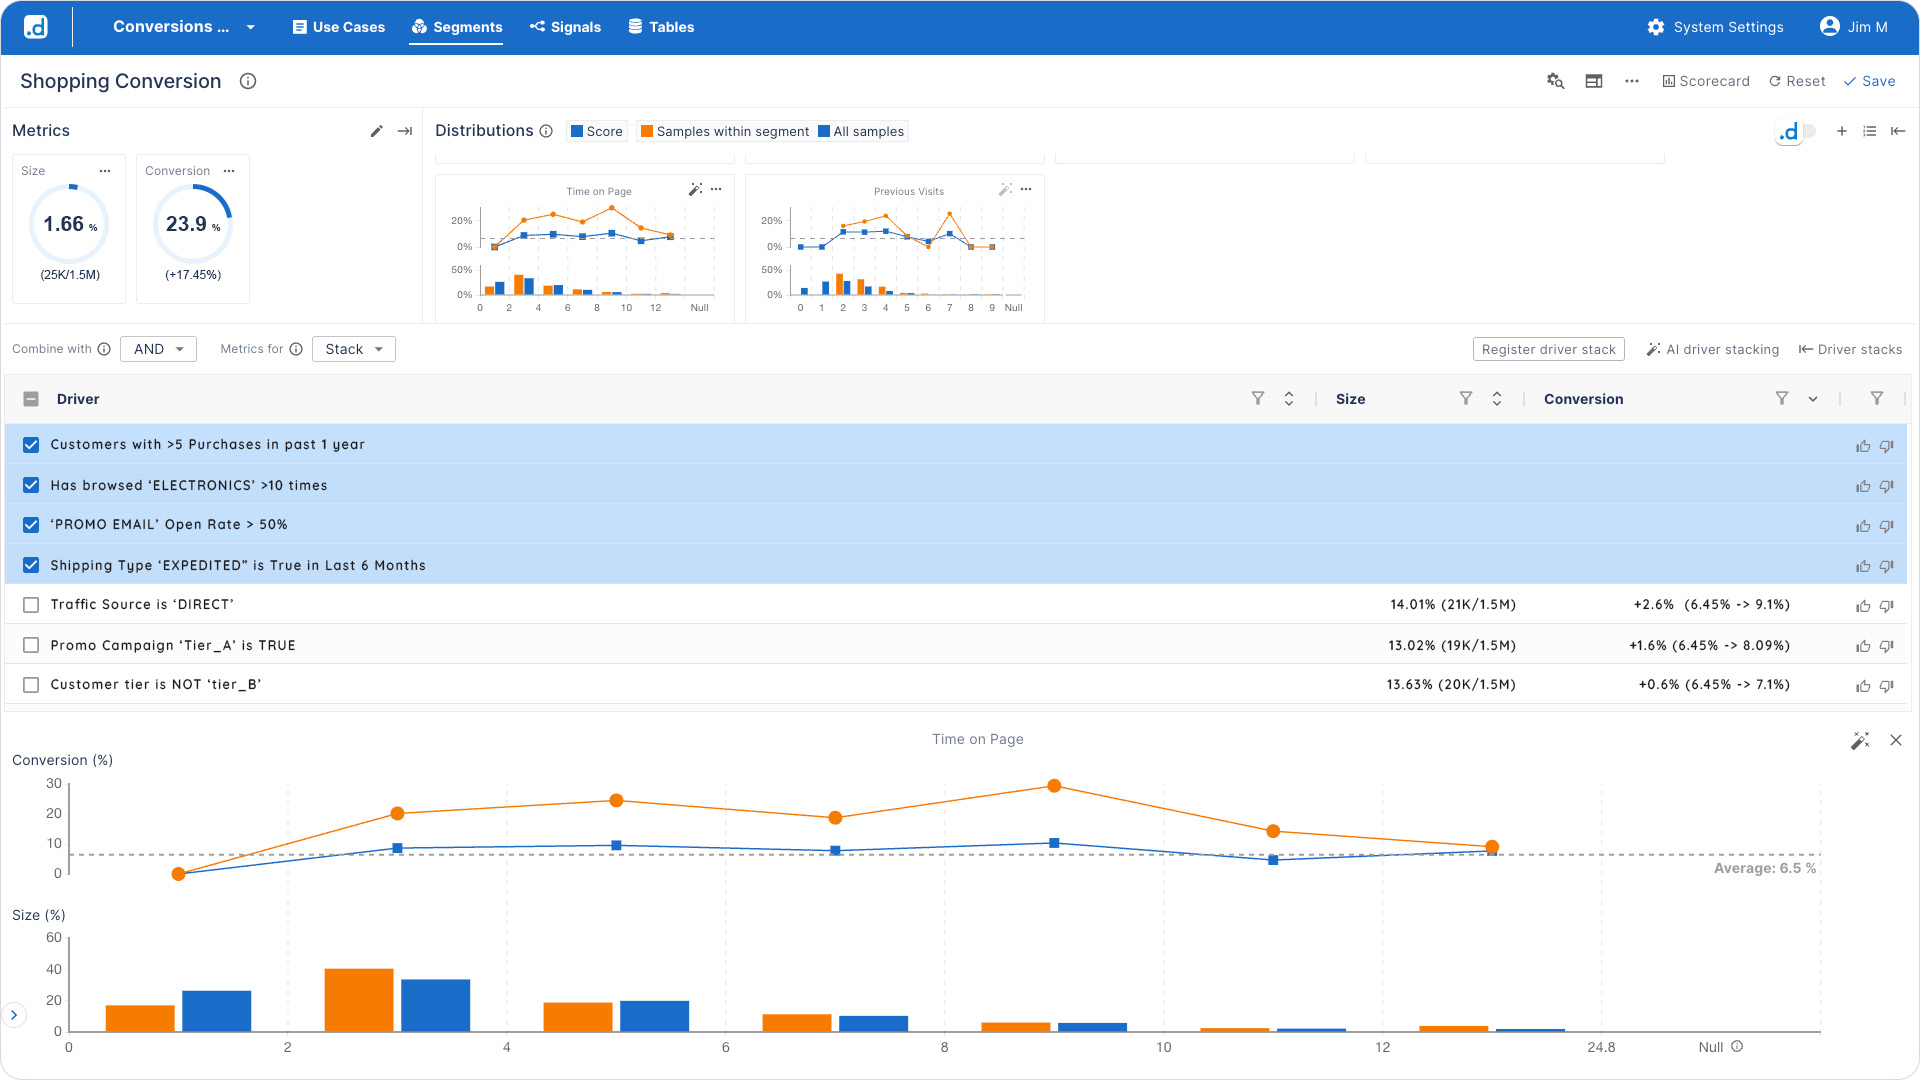
In just a few minutes, without writing a single line of code, Ben has defined a high-potential micro-segment: “Highly-Engaged, Frequent Electronics Shoppers Who Are Sensitive to Shipping Costs.” The platform indicates that 27,500 customers match this exact profile. This is his perfect target audience. In one click, Ben can export a highly targeted list for use in the company’s marketing automation tools, featuring a focused campaign that leverages the newly gained insight by offering free shipping.
The Journey from Broad, Generic Marketing to Hyper-Personalized, AI-Driven Engagement is an Evolutionary Process. Organizations do not leap from one end of the spectrum to the other overnight. Instead, they progress through a series of stages, each characterized by increasing sophistication in data usage, analytical techniques, and strategic impact. Understanding this progression—the micro-segmentation Maturity Curve—enables business leaders to accurately assess their organization’s current standing and chart a clear, actionable path forward.
The road to micro-segmentation takes place across four distinct stages of maturity:
This stage is defined by the use of high-level segmentation, primarily descriptive in nature, and addresses “what happened” questions. Segments are built using readily available, static data, most often demographic data (such as age and income) and geography (such as zip code and state). These segments are broad, few in number, and analytics are backward-looking.
Organizations at this stage have moved beyond simple demographics and are using more sophisticated techniques on historical data to diagnose why specific outcomes occurred. This is the realm of traditional, hypothesis-driven segmentation. Teams employ methods like RFM analysis and statistical clustering to create more nuanced groups based on past behaviors. They can answer “what happened?” and are beginning to understand “why it happened?”
At this stage, the organization begins to leverage AI and machine learning to uncover hidden patterns in its data, thereby gaining a deeper understanding of the key indicators that drive business outcomes. Automated discovery of patterns becomes a core capability, enabling data science teams to build models that are more accurate than ones based purely on human-curated features.
AI-driven analytics not only predict future outcomes but also recommend optimal actions for each discovered micro-segment. With AI-driven analytics, segments are no longer static but become dynamic, updating in near real-time based on the most current data.
To provide a clear diagnostic tool and strategic roadmap, the fundamental differences between the traditional approach (Stages 1-2) and the modern, AI-driven paradigm (Stages 3-4) can be summarized as follows:
| Attribute | Traditional Segmentation | AI-Driven micro-segmentation |
|---|---|---|
| Approach | Hypothesis-driven, manual | Data-driven, automated discovery |
| Data Used | Primarily demographic, high-level transactional | Deep behavioral, transactional, unstructured |
| Segments | Broad, static, and few in number | Granular, dynamic, potentially thousands |
| Insights | Confirms known business rules | Uncovers unknown, non-obvious patterns |
| Speed | Slow, project-based | Fast, continuous, near real-time |
| Primary User | Analyst, marketer | Data scientist, business user (with modern tools) |
This framework serves as more than just a classification system; it is a strategic guide. It allows a business leader to instantly grasp the fundamental differences between their current state and the desired future state, highlighting the specific capabilities—in technology, process, and people—required to advance along the curve. The path to AI adoption becomes a structured and achievable journey rather than an abstract and intimidating leap.
Customer segmentation must transition from one-size-fits-all or rule-based and statistically based approaches to one that leverages the power of AI-driven feature discovery. By leveraging Artificial Intelligence, organizations can build a data-driven engine for micro-segmentation to uncover subtle, non-obvious patterns that serve as powerful indicators of customer behavior. By democratizing AI-powered insights, business users can transition from discovery to action with unprecedented speed and precision.
For decades, the practice of business analytics has been framed as a search for a needle in a haystack. Traditional segmentation offers a slightly better approach to searching the haystack by dividing it into more manageable quadrants; however, it remains a manual, hypothesis-driven search, limited by what we already think we know.
AI-driven micro-segmentation helps to change the paradigm. It is no longer about searching the haystack, but instead about building a powerful magnet. By using AI to understand the deep, underlying characteristics and behavioral DNA of your most valuable customers, you create a force that attracts more of them.
The most profitable customers are not lost; they are simply hidden in plain sight, obscured by the noise of averages and the limitations of broad categorizations. The challenge for every modern business is to move beyond this outdated lens. It is time to stop guessing what might work for the “average” customer and start knowing what will work for the right customers. By embracing the power of AI-driven discovery, you can finally find the valuable, actionable, and profitable micro-segments that are waiting to be activated within your own data.
Here are 5 FAQs for the article “micro-segmentation: A Data-Driven Guide”:
Micro-segmentation intelligently divides the entire customer base into exact, granular groups based on a deep, multi-faceted understanding of their behaviors, needs, and characteristics. Micro-segmentation enables businesses to move beyond coarse generalizations and broader segments to create more precise segments and smaller groups, allowing for tailored marketing strategies to accelerate revenue growth and customer lifetime value. Traditional segmentation, in contrast, uses broad, logical categories (e.g., “high income earners”) that often fail to recognize the diverse sub-segments within them.
Both rule-based (e.g., RFM analysis) and statistical (e.g., K-Means clustering) methods are constrained by the analyst’s initial hypotheses. They are labor-intensive, slow to implement, struggle with highly dimensional data, and primarily validate or refine existing business suspicions. This creates a “domain bias” that prevents the discovery of unexpected drivers of behavior.
AI feature discovery, as exemplified by dotData Feature Factory, automates the process of sifting through raw data to uncover hidden signals and multi-step behavioral patterns that human analysts might not have conceived. This shift from hypothesis-driven to data-driven analysis enables the creation of thousands of new, potentially predictive features in a fraction of the time, leading to more accurate models and the identification of new micro-segments.
Platforms like dotData Insight are designed for business users, abstracting away complexity with intuitive visual interfaces. Business users can build segments by combining business drivers in plain English, interactively refining their hypotheses, and instantly visualizing results. This democratizes AI-powered discoveries, allowing marketing leaders, for example, to define high-potential micro-segments and quickly activate targeted campaigns.