Unlocking Hidden Yield & Quality Drivers with AI-driven Business Intelligence for Manufacturing
Industry Use Cases
Walter Paliska
Join Our Newsletter
Introduction: The Importance of Manufacturing Yield and Quality
Optimizing yield and maintaining high-quality standards in manufacturing processes is critical to the profitability of manufacturing companies. The Cost of Poor Quality (CoPQ) — encompassing scrap, rework, rejects, and recalls — is widely estimated to consume between 5% and 30% of gross sales, potentially reaching 40% of operational expenses in sectors such as the life sciences. For example, McKinsey reported that a semiconductor firm lost $68 million due to yield issues and that scrap rates in complex processes could exceed 20%.
Achieving consistent yield and quality is increasingly challenging in the manufacturing industry. Modern manufacturing processes generate vast quantities of complex data from diverse sources: sensor readings (temperature, pressure, vibration), Manufacturing Execution System (MES) and Supervisory Control and Data Acquisition (SCADA) parameters, material data from ERP systems, environmental data, equipment states, operator inputs, and customer data.
Manufacturing companies track Key Performance Indicators (KPIs) like First Pass Yield (FPY), Rolled Throughput Yield (RTY), defect rates, and scrap percentages. However, these metrics typically describe outcomes without revealing the underlying causes. Understanding why yield fluctuates or quality degrades, especially across multiple products or batches that are sensitive to subtle variations, requires a deeper analysis.
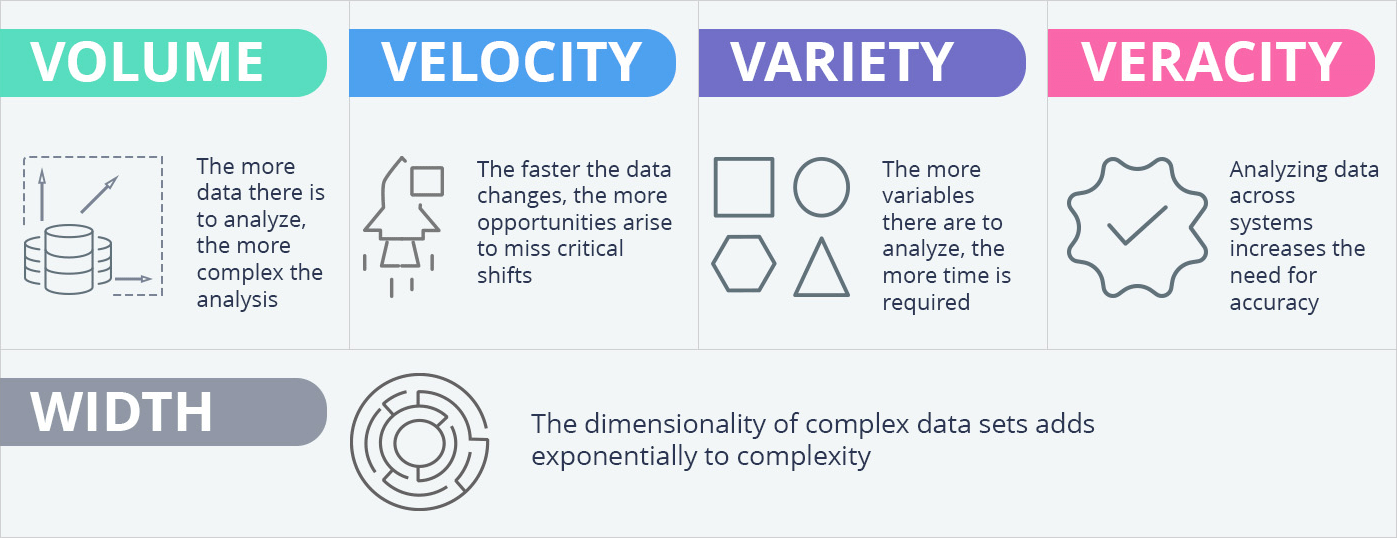
Volume, Width, and Complexity
Effective yield and quality optimization are hindered more by complexity and high dimensionality than by data volume, often referred to as “wide” data. Consider typical manufacturing scenarios:
Volume & Velocity: Terabytes of business data generated daily, often streaming in near real-time from Industrial Internet of Things (IIoT) devices, Programmable Logic Controllers (PLCs), and control systems.
Variety: A mix of structured (parameters, test results), semi-structured (batch logs), and potentially unstructured data (notes, images).
Veracity: Ensuring data accuracy and consistency across disparate systems, such as Laboratory Information Management Systems (LIMS) and Historians, remains a challenge, compounded by data silos.
Width (Dimensionality): This is often the most significant obstacle for business intelligence in manufacturing. A single production run might involve hundreds or thousands of logged parameters. Identifying specific combinations of factors within such wide production data is often not feasible. This complexity frequently prevents in-depth analysis and leads to reactive analysis after problems have occurred.
Deep Analytics: Moving Beyond Surface-Level KPIs
Traditional Business Intelligence for manufacturing is designed to visualize historical data, known metrics, and identify trends. They answer questions like, “What was our yield last quarter?” or “Show me the trend in defect rates for Product X.” This descriptive reporting is valuable, but rarely provides the diagnostic or prescriptive depth needed to drive significant improvements. Conventional BI systems and intuitive dashboards can show what happened to a KPI, but seldom reveal the causes.
Deep analysis aims to answer the more challenging, more valuable questions:
Which specific combination of process parameters (even within specification), material properties, equipment settings, and operational actions maximizes yield or minimizes defects for a particular product or batch?
Are there specific thresholds for variables (e.g., temperature, pressure, concentration) within accepted ranges that significantly increase defect probability?
Do hidden interactions exist between seemingly unrelated factors (e.g., a specific raw material lot combined with machine calibration state and ambient humidity) that degrade performance?
Can statistically significant microsegments (e.g., batches run on Line 3 with Material Y during the night shift) be identified, and the reasons for their performance understood?
Answering these questions requires moving beyond simple correlations to uncover statistically significant drivers and their optimal operational windows. Relying solely on high-level KPIs and Subject Matter Expert (SME) intuition is inadequate in data-rich environments. Binary pass/fail criteria often mask underlying process variations impacting performance.
Common Approaches & Their Deep Limitations
Manufacturing companies have employed various methods to tackle yield and quality analysis, but each comes with significant challenges in the face of modern business data complexity:
1. Manual Analysis (Spreadsheets & SMEs):
Approach: Experienced engineers and analysts manually export data (frequently into Excel), perform calculations, create pivot tables and charts, and use domain expertise to hypothesize root causes. Root Cause Analysis (RCA) is often performed manually based on these explorations.
Limitations:
Excruciatingly slow: Manually analyzing data with hundreds of columns is time-consuming and tedious.
Poor Scalability: It’s impossible to explore all potential interactions comprehensively in large, wide datasets.
Prone to Bias & Inconsistency: Results can vary depending on the analyst’s experience and the specific variables they choose to investigate.
Limited Scope and Depth: Manual analysis often focuses on a limited number of suspected variables, potentially omitting complex and non-obvious interactions that are hidden deeper in the data.
Error-prone: Manual data manipulation, copying and pasting, and formula creation significantly increase the risk of errors that can invalidate results.
2. Traditional Business Intelligence & Visualization Tools (Tableau, Power BI, Qlik, etc.):
Approach: Provide dashboards and visualizations to track KPIs, explore data trends visually, and generate routine reports.
Limitations:
Descriptive, Not Diagnostic: Ideal for showing trends but lacks the built-in analytical horsepower to discover underlying drivers within wide, complex data without significant manual exploration.
Hypothesis-driven and static: Users need to know what they seek. BI tools are like flashlights: they shine only in the direction you point them and don’t proactively surface hidden patterns across hundreds of variables. Hidden drivers outside developed reports remain hidden.
Struggle with “Wide” Data: While conventional manufacturing business intelligence tools can connect to various sources, analyzing the combined impact of hundreds of columns simultaneously to find key drivers is not their core strength.
Lack of Causal Insight: Perhaps most importantly, existing tools rarely explain the reasons behind changes in KPIs. A dashboard might show defect rates spiked when humidity rose. Still, it won’t automatically tell you that 93% of defects occurred only when humidity > 55%, nor propose the hypothesis that “High humidity is linked to micro-void formation, causing defects.”
3. Statistical Software & Process Control (SPC) Tools (SAS, R, Python, Minitab, etc.):
Approach: Utilizing statistical programming languages or dedicated SPC packages for in-depth analysis, control charting, regression, and hypothesis testing.
Limitations:
Niche Expertise: Requires data scientists or statisticians proficient in these tools and advanced statistical methodologies.
Time-Intensive Hypothesis Generation: While powerful for testing hypotheses, generating the initial hypotheses across hundreds of potential drivers requires significant manual effort or domain knowledge before using the tool.
Limited Scope: SPC tools help enforce process limits for predefined metrics, but they focus on known variables by design. If a yield issue is driven by an overlooked factor or a complex interaction (e.g., if valve_A is open AND chemical_X < 5%, then yield drops), traditional SPC won’t flag it unless an engineer specifically codified that rule. SPC charts require manual setup and typically only cover a few dimensions at a time.
Complexity and Maintenance: Statistical programming is a slow process that requires code to be written, validated, and maintained. This results in increased analysis costs and infrequent data exploration due to the poor return on investment (ROI) of exploring for new patterns.
Manual Analysis
BI Tools
Statistical Software & Process Control
Example Tools
Excel, Spreadsheets
Tableau, Power BI
SAS, R, Python, Minitab
Speed of Analysis
Very slow
Slow
Slow
Scalability
None
Poor
Poor
Skill Required
Low to Medium
Medium-High
Very High
Scope
Very limited
Limited
Limited by skill & predefined metrics
Complexity
Medium
High
Very High
A New Approach: Deep Analytics with Statistical AI + GenAI
Deep analytics platforms offer a method to overcome traditional business intelligence limitations by automatically exploring the full breadth of complex manufacturing data. dotData Insight exemplifies this approach, shifting from manual hypothesis testing to automated, large-scale hypothesis generation and validation directly from raw and real-time data.
dotData Insight achieves this through a unique, synergistic combination of Statistical Artificial Intelligence (AI) and Generative AI:
1. Statistical AI and Generative AI:
This engine connects directly to your diverse data sources, including databases, data lakes, historians, and flat files containing numeric, categorical, text, and time-series data. Its core strength lies in automated pattern discovery and analysis across wide datasets. Think of it as using radar for analyzing data. dotData systematically explores millions of potential patterns, relationships, interactions, and variables across hundreds of columns, identifying statistically significant patterns related to your target KPI (e.g., yield percentage, defect count, quality score). It automatically scores and ranks each identified pattern based on its impact, surfacing critical hidden drivers.
Statistical patterns alone can be complicated for non-experts to interpret (e.g., Variable_A > 5.2 AND Sensor_X < 101.3). dotData Insight employs GenAI, infused with domain context, to translate these complex findings into human-readable “Business Drivers.” It explains the pattern in clear business language, making data-driven insights immediately understandable and actionable for engineers, managers, and operations teams.
Key Capabilities Tailored for Manufacturing Intelligence Challenges:
AI-Driven Signal Discovery: Users define a target KPI (e.g., pass/fail flag, yield percentage, number of defects) and point the platform to the relevant data tables. dotData automatically identifies the dozens of data patterns and signals that most influence the KPI. It explores correlations, aggregations, categorical splits, time-series patterns, and more beyond traditional BI capabilities. No coding is needed.
Uncover Hidden Business Drivers: This tool automatically identifies the key factors (and, significantly, their combinations) from hundreds or thousands of potential variables that have the most significant impact, positive or negative, on your yield or quality KPIs. It often reveals drivers overlooked by traditional BI solutions.
Magic Threshold Discovery: Standard specifications often define broad acceptable ranges. However, within those ranges, there may be specific “magic thresholds” at which performance changes dramatically. dotData Insight automatically discovers the optimal value ranges or specific categorical combinations for each key driver, pinpointing the sweet spots (or danger zones) for critical parameters such as temperature, pressure, cycle time, chemical concentrations, material lots, or even specific operator actions to improve operational efficiency, which conventional BI solutions cannot.
Driver Stacking & Micro-Segmentation: Understanding individual drivers is good; understanding their combined effect is powerful. dotData Insight allows you to interactively “stack” multiple business drivers together. As you add drivers, the platform instantly recalculates the impact on your KPI for the resulting micro-segment of data. This allows you to identify and analyze specific populations within your production that dash and exhibit exceptionally high or low performance, pinpointing which factors improve production management. It intelligently balances the size of the segment against the improvement in the KPI to identify meaningful and actionable groups.
Generative AI Interpretation: dotData doesn’t leave you with a spreadsheet of statistical outputs. An integrated generative AI transforms the discovered signals into clear business hypotheses and narratives, thereby bridging the gap between data and operational reality.
No-Code, Intuitive Interface: Designed for BI users, power users, process engineers, and analysts – not just elite data scientists. You can upload data, define business objectives using familiar terms, and start exploring deep real-time insights quickly without writing a single line of code.
Real-World and Real-Time Data Complexity: It is designed to ingest and analyze the diverse, messy data commonly found in manufacturing—relational, transactional, temporal (automatically handling seasonality, lags, and holidays), geolocational, and even text data. It also includes AI-powered data cleansing features to help identify and address common data quality issues transparently.
Actionable Scorecards: The system automatically builds a scorecard of conditions for each sample (e.g., each batch or wafer), highlighting exactly which runs match the high—or low-performance segments. This makes it easy to see which factors influenced a specific outcome and to make strategic decisions.
By automating the most laborious and complex parts of deep data exploration and providing clear, actionable insights, dotData Insight empowers your teams to focus on using the data for process optimization and operational efficiency improvement rather than spending endless cycles wrangling it.
Magic Threshold Discovery & Signal Stacking to Maximize Yielding in Pharma Manufacturing
In pharmaceutical manufacturing, bioreactors operate under delicate conditions that can negatively impact the results. The processes are characterized by various factors, including flows, temperatures, pH conditions, aeration, and concentrations, which are just a few of the many variables that influence the production of pharmaceuticals.
For example, numerous factors can impact the overall yield of the penicillin production process. For this example, we leveraged the freely available dataset from the Industrial Scale Penicillin Simulator website, which is described as a “mathematical model of a Penicillium chrysogenum fermentation.”
By collecting data associated with the production process and utilizing it in dotData Insight, we can leverage Insight’s Statistical AI discovery technology to identify signals that impact yield problems. dotData Insight also precisely identifies a “magic threshold,” a range of values that impact yield. For example, we found that a change in reactor temperature of 0.05 K significantly correlates with yield. Separately, it also discovered that the cooling water flow < 150 L/h is also impactful.
With dotData Insight, users can also combine identified signals – known as driver stacking – to build micro-segments based on multiple conditions to determine impact on yield. For example, combining a Reactor Temperature change of 0.05K with cooling water flow < 150 L/h discovered a micro-segment representing 46% of batches that exhibit a 15% higher yield than average when the two conditions are present simultaneously.
Users can also leverage the power of Generative AI and machine learning to interpret signals and build a richer, more insightful interpretation. For example, analyzing a time-based temperature-related business driver gave this interpretation from the GenAI engine:
“The total temperature in the batch over the last 7 days being between 298.05K and 298.32 K suggests that there might be slight fluctuations or inconsistencies in the temperature control. These fluctuations can negatively impact the chemical reactions or processes, leading to a higher rate of underYield. In contrast, more stable temperature conditions outside this range might result in better yields.“
From raw data to actionable hypotheses, this process can be completed in minutes compared to the weeks or months required to analyze the same data using traditional techniques.
Real-World Impact: Translating Deep Insights to Business Value:
Reduced Waste & Scrap: Understanding the precise conditions leading to defects enables proactive adjustments to Standard Operating Procedures (SOPs), control limits (based on Magic Thresholds), quality checks, or supplier performance management. Reductions in CoPQ (typically 5-30% of revenue) yield substantial savings. AI-driven analysis has shown potential yield detraction reductions up to 30%.
Increased Throughput and Efficiency: Optimizing processes based on data insights reduces rework and investigation time (“firefighting”) and leads to smoother production flow, improving Overall Equipment Effectiveness (OEE) and plant throughput, reducing equipment failures.
Improved Product Consistency & Quality: Controlling key drivers ensures consistent manufacturing under optimal conditions, leading to higher average quality and revenue.
Faster Root Cause Analysis (RCA): Pre-identified drivers and segmentation capabilities enable the timely delivery of insights and the pinpointing of root causes when deviations occur.
Data-Driven Decision-Making: The organization shifts from guesswork to objective, data-backed strategic decisions for process improvements, investments, and operational adjustments. Providing specific, actionable, and meaningful insights, such as “When Furnace #2 operates between 850-875°C with material batch ‘XJ-2’, yield for Product Z increases 4.5%”, enables targeted action.
Actionable Takeaways: Starting Your Deep Analysis Journey
Ready to move beyond surface-level manufacturing BI and unlock the hidden potential in your manufacturing data? Here are concrete steps manufacturing leaders and data teams can take:
Treat yield and quality as Strategic Business Metrics: Quantify the actual cost of non-quality (TCNQ) in your operations. Understand how much scrap, rework, and defects are costing you.
Break Down Data Silos: Integrate relevant data sources as a priority. Process data, including machine logs and sensor readings from historians and SCADA systems, quality test results from LIMS or test stations, operational data from MES records and operator logs, and material data from ERP systems and supplier specifications, must be accessible for joint analysis.
Identify High-Value Use Cases: Begin with the most critical or costly yield or quality challenges that impact your business. Where are the most significant pain points, mysteries, or opportunities for improvement?
Move Beyond Spreadsheets and Static Reports: Invest in and embrace modern manufacturing data analytics capabilities, particularlyAI-driven tools for automated insight discovery. Recognize that traditional BI tools and SPC are necessary but insufficient for uncovering complex, multi-factor drivers at scale or custom reports.
Explore Modern Deep Analytics Tools: Evaluate solutions designed to automate the discovery of drivers and patterns in extensive, complex data. Prioritize platforms emphasizing explainability (like dotData Insight’s GenAI hypotheses), ease of use for your existing analytics and business teams (no-code interfaces), and the ability to handle the complexity of real-world manufacturing data.
Empower Cross-Functional Teams & Trust AI Signals: Combine the irreplaceable domain expertise of your engineers, quality managers, and operators from multiple departments with the power of automated data analysis for strategic planning. Use AI-driven tools to augment human intelligence, not replace it. Encourage teams to trust the signals generated by the AI, while validating them, and use them as powerful starting points for investigation rather than relying solely on manual filtering and intuition. dotData’s generative AI explanations help bridge the communication gap, enabling everyone to understand the insights and make informed decisions.
Start Small, Iterate Quickly, and Monitor Continuously: You don’t need a massive, multi-year project to begin. Start with a focused pilot project on a key product line or process step. Demonstrate value quickly, learn, and then expand the application of deep analytics. Manufacturing processes evolve, so analytics shouldn’t be a one-off study. Rerun AI signal discovery regularly (dotData makes this easy with one-click updates and scorecards) to monitor changes and ensure your understanding of key drivers remains current. Build a culture where data-driven decision-making is the norm.
Conclusion: Stop Guessing, Start Driving Performance with Deep Insights
Optimizing yield and quality is crucial in the manufacturing industry, particularly in today’s competitive environment. The solutions to complex operational challenges often reside within vast datasets; however, traditional manufacturing business intelligence methods struggle to extract deep, actionable insights for efficient decision-making. Manual exploration, standard BI tools, and conventional SPC are frequently too slow, narrow, or dependent on intuition to handle modern data complexity effectively.
Deep data analysis, exemplified by platforms like dotData Insight, provides a path forward for business intelligence in manufacturing. By combining the pattern-finding capabilities of Statistical AI with the explanatory power of Generative AI, these tools automate the discovery of critical business drivers impacting yield and quality. They identify optimal operational thresholds (“Magic Thresholds”) and reveal the combined effects of multiple factors through micro-segmentation, all of which are explained in clear business terms.
This approach empowers analysts, engineers, quality managers, and operations leaders to transition from reactive problem-solving to proactive optimization based on objective, data-driven evidence. Stop letting valuable insights remain hidden and start making informed decisions. Unlock the proper drivers of manufacturing performance and establish a sustainable, data-driven competitive advantage.
Walter brings 25+ years of experience in enterprise marketing to dotData. Walter oversees the Marketing organization and is responsible for product marketing and demand generation for dotData. Walter’s background includes experience with both software and hardware companies, and he has worked in seven different startups, including three successful bootstrap startups.
dotData's AI Platform
dotData Feature Factory
Boosting ML Accuracy through Feature Discovery
dotData Feature Factory provides data scientists to develop curated features by turning data processing know-how into reusable assets. It enables the discovery of hidden patterns in data through algorithms within a feature space built around data, improving the speed and efficiency of feature discovery while enhancing reusability, reproducibility, collaboration among experts, and the quality and transparency of the process. dotData Feature Factory strengthens all data applications, including machine learning model predictions, data visualization through business intelligence (BI), and marketing automation.
dotData Insight is an innovative data analysis platform designed for business teams to identify high-value hyper-targeted data segments with ease. It provides dotData's hidden patterns through an intuitive, approachable interface. Through the powerful combination of AI-driven data analysis and GenAI, Insight discovers actionable business drivers that impact your most critical key performance indicators (KPIs). This convergence allows business teams to intuitively understand data insights, develop new business ideas, and more effectively plan and execute strategies.
We use cookies on our website to give you the most relevant experience by remembering your preferences and repeat visits. By clicking “Accept All”, you consent to the use of ALL the cookies. However, you may visit "Cookie Settings" to provide a controlled consent. Read More
This website uses cookies to improve your experience while you navigate through the website. Out of these, the cookies that are categorized as necessary are stored on your browser as they are essential for the working of basic functionalities of the website. We also use third-party cookies that help us analyze and understand how you use this website. These cookies will be stored in your browser only with your consent. You also have the option to opt-out of these cookies. But opting out of some of these cookies may affect your browsing experience.
Necessary cookies are absolutely essential for the website to function properly. These cookies ensure basic functionalities and security features of the website, anonymously.
Cookie
Duration
Description
cookielawinfo-checkbox-analytics
11 months
This cookie is set by GDPR Cookie Consent plugin. The cookie is used to store the user consent for the cookies in the category "Analytics".
cookielawinfo-checkbox-functional
11 months
The cookie is set by GDPR cookie consent to record the user consent for the cookies in the category "Functional".
cookielawinfo-checkbox-necessary
11 months
This cookie is set by GDPR Cookie Consent plugin. The cookies is used to store the user consent for the cookies in the category "Necessary".
cookielawinfo-checkbox-others
11 months
This cookie is set by GDPR Cookie Consent plugin. The cookie is used to store the user consent for the cookies in the category "Other.
cookielawinfo-checkbox-performance
11 months
This cookie is set by GDPR Cookie Consent plugin. The cookie is used to store the user consent for the cookies in the category "Performance".
viewed_cookie_policy
11 months
The cookie is set by the GDPR Cookie Consent plugin and is used to store whether or not user has consented to the use of cookies. It does not store any personal data.
Functional cookies help to perform certain functionalities like sharing the content of the website on social media platforms, collect feedbacks, and other third-party features.
Performance cookies are used to understand and analyze the key performance indexes of the website which helps in delivering a better user experience for the visitors.
Analytical cookies are used to understand how visitors interact with the website. These cookies help provide information on metrics the number of visitors, bounce rate, traffic source, etc.
Advertisement cookies are used to provide visitors with relevant ads and marketing campaigns. These cookies track visitors across websites and collect information to provide customized ads.