
Discovering Hidden Insights with Data Analytics For Retail – Part 2
- Industry Use Cases
In Part 1 of this blog, we addressed the challenge retailers face in translating vast amounts of data into actionable insights, highlighting the paradox of being “drowning in data but starving for insight.” We explored the limitations of traditional Business Intelligence (BI) tools, which primarily report historical customer data rather than uncovering the underlying patterns and drivers of customer behaviors and customer interactions. The section further details why standard approaches to personalization, often relying on broad demographic or RFM segmentation, fail to meet consumer expectations for tailored experiences. Finally, Part 1 examines existing loyalty suites and platforms, both for enterprises and mid-market companies, highlighting their challenges with complex data, multiple data sources, hypothesis-driven approaches, and limitations in identifying time-sensitive or non-obvious drivers that influence retail sales performance, thereby hindering effective personalization and customer satisfaction improvement.

The most critical limitation of both enterprise and mid-market deep-dive tools and loyalty platforms is their overreliance on predefined models. Legacy platforms cannot sift through datasets with potentially hundreds or thousands of columns to identify specific combinations or factors and precise thresholds that have the highest impact on any given KPI.
In these instances, analysts and data scientists must manually explore available historical data, formulate hypotheses, build and test models, and iterate through the process. This process is slow and expensive, and often misses counterintuitive or deeply buried relationships.
Products like dotData Insight represent a paradigm shift from traditional business intelligence (BI) and SQL-based analysis. Insight is an AI-powered platform specifically designed to overcome the limitations of conventional retail analytics tools when exploring deep patterns within complex, large datasets.
At the heart of dotData Insight is the automated discovery of hidden patterns and statistically significant signals – called “business drivers.” dotData Insight excels at finding the “unknown unknowns” — the non-obvious factors and intricate interactions that profoundly impact key performance indicators (KPIs) but are often missed by standard reporting, data visualization and manual exploration.
dotData Insight employs a unique combination of AI technologies tailored for deep data analysis in the retail industry:
dotData Insight utilizes Statistical AI to automatically analyze large volumes of diverse data, potentially spanning hundreds or thousands of columns. The platform systematically explores the relationships between numerous data points, ranging from granular point-of-sale (POS) details and customer interactions to sales and inventory levels, operational metrics, labor and shipping cost, external factors, customer relationship management metrics, past sales data, and other relevant data. It correlates them with a specific target KPI, such as Shrinkage Rate, Customer Lifetime Value (CLV), or Marketing Campaign Response, to identify the unknown unknowns in your data.
A statistically significant pattern involving multiple variables and conditions can be complicated even for seasoned analysts to decipher quickly, let alone for business managers. dotData Insight addresses this by leveraging Generative AI to translate identified business drivers into clear, concise, and human-readable versions.
Instead of grappling with coefficients and p-values, a user might be presented with an insight like:
Transaction in last 7 days for ‘CRACKERS/MISC BKD FD’ and Number of Transactions in last 30 days, is more than or equal to 31, and Percent of transactions with ‘BEEF’ in the last 90 days is between 0% and 4.5% sign up for loyalty programs 91% of the time.
This natural language explanation is easily understood to mean: “Customers who have purchased beef in the past 90 days, and have made more recent purchases in the past 30 days, including Crackers in the past 7 days, sign up for loyalty programs 91% of the time.”
Based on this analysis, the analyst could hypothesize that large families or small businesses might be responsible for meeting the criteria of buying more than 31 items in any given month, while also needing to purchase beef and crackers for the family or business. The retailer could identify new customers from the past month who met the discovered criteria (the micro-segment) but were not members of the loyalty program. The members of this micro-segment could then be targeted for sign-up by offering discounts on frequently purchased items.
This type of analysis makes sophisticated insights immediately accessible and understandable across different roles within the organization, fostering a better and faster informed decision-making process.
Understanding that a factor drives a KPI is useful, but knowing precisely when its impact is most significant is far more actionable. dotData Insight incorporates Magic Threshold Discovery to analyze each identified business driver and pinpoint the ideal value ranges, categories, or thresholds within that driver that have the most significant positive or negative effect on the target KPI.
For instance, this type of system can automatically identify a key factor like:
“Customers who have made more than 14 unique transactions in the last 90 days.”
This factor indicates the purchasing frequency of a loyal customer. Crucially, the system also reveals that 82.2% of these frequent buyers—those with 14 or more unique transactions in the last three months—were enrolled in the loyalty program. The system automatically determined the threshold of “14 unique transactions,” a detail that would be extremely difficult and time-consuming for an analyst to uncover manually.
dotData Insight empowers users by allowing them to combine multiple discovered business drivers interactively, or “stack” them. As users select and combine drivers, the platform recomputes outcomes in real-time, showing the cumulative impact of these combined conditions on the KPI.
This capability is compelling for creating highly specific, data-driven micro-segments. By stacking drivers, users can isolate niche groups with unique characteristics and predict their likely outcomes. For instance, combining drivers such as:
“Customer purchased promotional item X,” “Visited website section Y within 2 days,” and “Loyalty points balance > Z”
might reveal a micro-segment with a significantly higher propensity to purchase a related product or, conversely, a higher risk of churn. Identifying such precise and targeted segments allows for the development of hyper-targeted marketing strategies, far exceeding the precision of traditional segmentation methods.
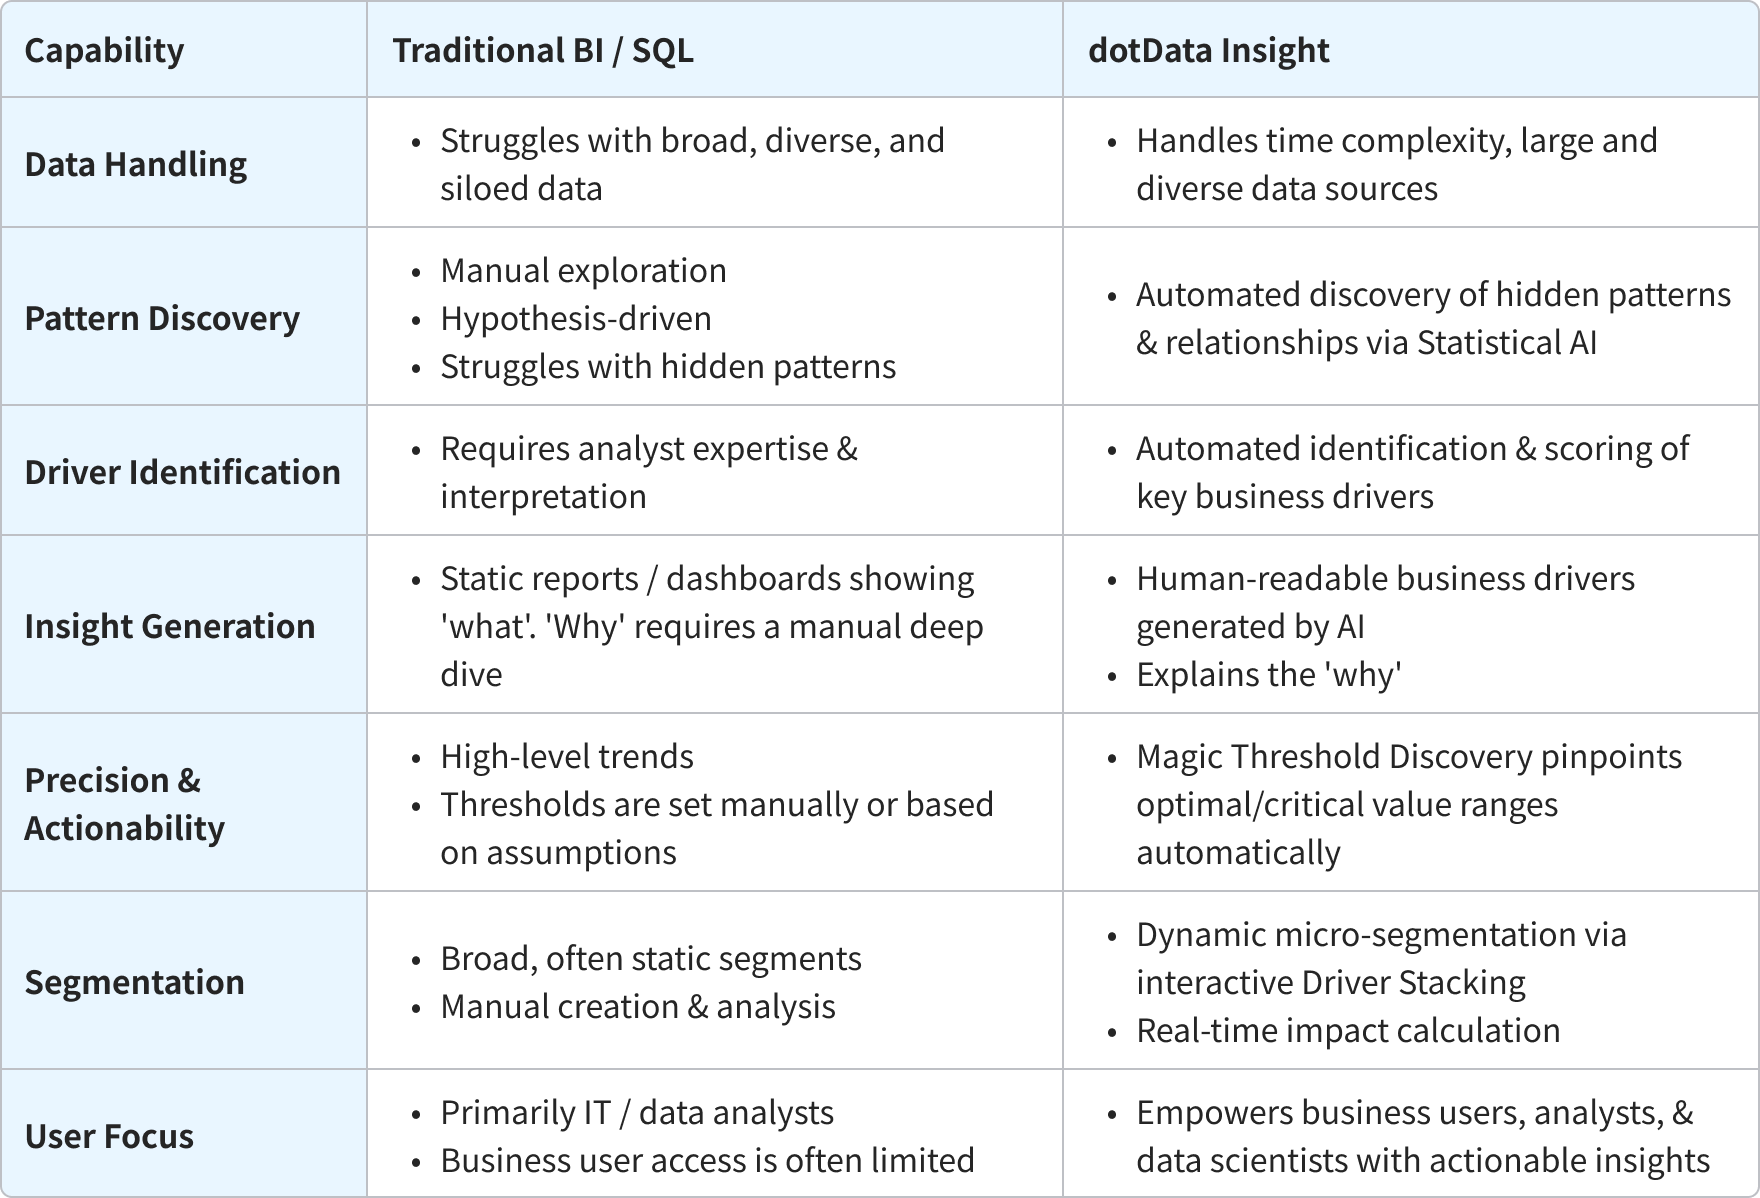
Table 1: Traditional BI/SQL vs. dotData Insight for Data Analytics in retail
Let’s consider how dotData Insight can be applied in a relatable scenario for a mid-sized regional convenience store chain:
This automated discovery, coupled with human-readable explanations and precise thresholds, provides the specific, actionable intelligence about customer shopping patterns and customer preferences. This advanced data analytics method empowers retailers to address root causes and optimize marketing strategies for customer loyalty — a capability extremely difficult and time-consuming, if not impossible, to achieve through manual retail analytics with traditional business intelligence tools.
Understanding the challenges of deep data analytics in retail and the potential of AI-driven discovery platforms like dotData Insight leads to several key strategic considerations for retail industry leaders aiming to leverage their data more effectively:
While data analytics in the retail industry involves processing vast amounts of customer data, the challenge lies in transforming that data into a deep, actionable understanding, particularly for complex and costly issues like inventory shrinkage and effective customer personalization. Traditional retail analytics tools, which rely on retrospective reporting and manually analyzing data, increasingly fall short, leaving significant value untapped and problems unaddressed at their root.
dotData Insight offers a fundamentally different path forward for the retail sector. It leverages a powerful combination of statistical AI for automated pattern discovery and Generative AI for human-readable insight generation, cutting through customer data complexity. Features like Magic Threshold Discovery provide the precise parameters needed for action, while Driver Stacking enables dynamic, data-driven micro-segmentation. This shifts the paradigm from merely reporting on what happened to truly understanding the intricate drivers behind business performance in the retail industry.