
The Paradox of In-Store and Online Retail Return Rate
- Industry Use Cases
The $850 billion question haunting every online retailer today isn’t about the size of their return rate. Instead, the question is which customer micro-segments are hiding the return rate. The National Retail Federation reports $849.9 billion in returns for 2025, 15.8% of annual sales. Online retailers’ average return rate is 24.5%, while in-store return rates hover around 8.7%.
For a mid-market retailer doing $50 million in annual sales, the math translates to roughly $12 million in returned merchandise flowing back through their systems—a figure that dominates logistics budgets, inventory planning, and ultimately, profitability.
But here’s where the conventional wisdom breaks down: a retailer’s aggregate return rate is a statistical illusion. Behind the 24.5% online average lies a landscape of wildly divergent return rates—some customer segments return items at 12%, while others return at 55%. The invisible cost driver isn’t the average; it’s the composition of returns hidden within your customer base, and more critically, which micro-segments are actually eroding margins.
This distinction matters enormously. A 50% return rate from a new customer acquired through paid social is a solvable business problem. A 35% return rate from your highest-CLV segment is an existential risk. Yet most retailers handle ecommerce returns the same way across both groups—treating the problem as a category or channel issue when it’s actually a customer behavior issue.

The standard retail approach to returns analysis is deceptively straightforward: segment by product category, by channel, by season. A fashion retailer will quickly learn that returns for women’s apparel (27.8%) far exceed those for men’s apparel (18.5%), and shoes (31.4%) outpace other categories. Online channels (24.5%) perform significantly worse than in-store sales (8.7%). These insights, while directionally useful, are also dangerously incomplete.
The problem isn’t that these segments exist—it’s that retailers typically analyze only these segments. They treat the return problem as fixed at the category or channel level, then attempt to solve it with blunt-force interventions, such as tightening return policies, improving product descriptions, or expanding video content. However, if returns are driven by customer micro-patterns, rather than just by what customers are buying or where they make purchases, then this entire approach misses the point.
Consider what happens in a typical ecommerce business during the holiday season. A retailer receives 100,000 orders. Twenty-four thousand five hundred of those online sales are returned—the industry average. Breaking that down further: maybe 26,000 online purchases came from paid social acquisition, 18,000 from email, 14,000 from organic search, and so on. The finance team tracks total online returns, perhaps segmenting by channel. So far, this is standard practice.
But what the dashboard doesn’t show is that within those 26,000 paid social orders, there exist several distinct customer cohorts with dramatically different return propensities:
Same channel. Same dollar volume. Three entirely different business problems masquerading as one.
The real complexity deepens when you layer in behavioral sequences. A customer who views a product, adds it to the cart, removes it 24 hours later, then returns to purchase exhibits an entirely different return profile than one who adds to the cart and checks out within 10 minutes. One signal suggests deliberation and intent; the other suggests impulse and uncertainty. Yet traditional e-commerce analytics treat them as interchangeable “checkout completions.”
Typical product return analysis tends to focus on “fit,” particularly for fashion products. Phrases like “expectation mismatch,” or “buyer’s remorse” tend to characterize the description of “drivers of returns” heavily. While true, these descriptions are incomplete. What retail analytics often misses are the combinations of customer behavior that predict returns far more accurately than any single factor.
Bracketing behavior offers the clearest example. Bracketing is the practice of ordering multiple sizes or colors of the same item with the intention of returning most of them. This represents 40% of online shopping behavior; among Gen Z, that number rises to 51%, compared to just 24% for Baby Boomers. The keep rate for bracketed items is approximately 75%, meaning customers keep ~38% of their orders and return 62% of unwanted items. This creates a bifurcated return problem: yes, returns are high, but these customers’ net spending is actually higher than it appears (because they’re keeping 75% of multiple orders), and their lifetime value may not accurately reflect that behavioral pattern.
Payment method dynamics represent another hidden driver. Customers using Buy Now, Pay Later (BNPL) services exhibit measurably higher return rates than those using credit cards, though the industry rarely surfaces this distinction. Why? There are multiple hypotheses, including reduced psychological commitment, easier post-purchase reconsideration, access to customers who are less established in their purchasing patterns, or simply that BNPL attracts price-sensitive shoppers who are more likely to second-guess their purchases. Regardless of the mechanism, this is a micro-pattern that predicts return behavior and is invisible in category-level analysis.
First-time buyer behavior adds another layer. New customers exhibit materially different return profiles than established customers, but within that group, there’s further variation based on how they arrived and what they researched. A new customer acquired through organic search who spent 8+ minutes reviewing product pages, looked at customer reviews, and browsed size charts shows a dramatically different return profile than a first-time customer arriving through a paid social ad, spending <1 minute on the product page, and proceeding directly to checkout. One customer telegraphs intent; the other telegraphs impulse.
Plus-size and extended sizing customers present a specific, addressable micro-pattern. This segment returns at 34.2%, which is significantly higher than the standard sizing. But here’s where micro-segment analysis reveals an intervention opportunity: plus-size returns might correlate strongly with “low engagement with size charts” and “viewed <3 product images.” This suggests that the return driver isn’t inherent to the customer segment, but instead to the product information gap for that segment—a data problem, not a customer behavior problem, and therefore solvable through targeted intervention before the return occurs.
Fraud and wardrobing constitute the starkest micro-pattern. While broader return fraud accounts for 15.14% of all returns nationally, this type of fraud is heavily concentrated in specific micro-segments, including customers with repeat return patterns, high-value item purchases followed by returns of worn goods, geographic clustering, and a history of previous chargebacks. This micro-segment isn’t evenly distributed; it represents perhaps 2-5% of your customer base but drives disproportionate margin destruction.

Here’s where most retailers’ analysis typically breaks down. These micro-patterns exist in your data—they’re measurable, they’re predictive, they’re actionable. The problem is discovering them at scale.
Traditional business intelligence tools are designed to answer questions you already know how to ask. A retailer can ask: “What’s the return rate for women’s fashion?” and Tableau or Looker will instantly provide the answer. This is analytics’ strength. But the question implied is narrow: “Compare this predefined segment against that predefined segment.” The system doesn’t explore beyond the boundaries you establish.
To discover hidden micro-patterns, you’d need to test potentially thousands of feature combinations:
With just 10 potential input variables, testing all meaningful combinations requires manual hypothesis generation and testing across dozens—if not hundreds—of individual reports. A data scientist could spend weeks building the necessary queries and analyses, and they’d still only test a small fraction of what’s possible. Worse, the patterns they discover would be biased toward their own domain expertise and hypotheses, creating a substantial risk of missing the truly novel, non-obvious signals.
This is the feature engineering bottleneck. In the lending world, where credit risk modeling demands sophisticated feature discovery, this bottleneck has become so severe that leading institutions are adopting automated approaches. The same bottleneck constrains retail analytics, particularly in merchandise returns analysis.
Traditional BI tools show you the forest (aggregated patterns) but can’t systematically show you the trees (micro-segment behaviors). They require manual work to explore potential trees, which means you’ll explore only a tiny fraction and likely miss the highest-impact signals.
The solution is to treat return behavior as a discovery problem rather than a reporting problem.
Imagine a data science or analytics team at a mid-sized online retailer that has decided to tackle its 24.5% return rate. Rather than hand-picking variables to analyze or manually reviewing category-level dashboards, they take a different approach: they systematically test all feasible combinations of online shopper attributes, behavioral signals, and transactional patterns against a single target variable (returned: yes/no).
Using automated feature discovery methods, the system loads raw data, including customer demographics, transaction history, product interactions, payment information, device data, browsing patterns, prior returns, and support interactions. Over the course of a few hours, the system generates and evaluates thousands of potential features (combinations), automatically ranking them by their predictive power and statistical significance.
The output isn’t a list of raw feature correlations. Instead, it’s a ranked leaderboard of business-interpretable drivers, each showing:
The leaderboard might show something like this (illustrative examples):
| Driver | Population | Return Rate | Baseline Lift |
|---|---|---|---|
| First-time buyer + BNPL payment | 3.2% | 52% | +36 pts |
| Plus-size fashion + <3 product images viewed | 4.7% | 38% | +22 pts |
| Paid social acquisition + discount code + mobile device | 2.8% | 45% | +29 pts |
| Repeat customer (3+ purchases) + full-price purchase + 6+ min browsing | 8.1% | 8% | -16 pts |
| High-CLV customer (>$500 lifetime) + premium tier membership | 1.9% | 6% | -18 pts |
This isn’t just reporting; it’s discovery. The leaderboard reveals which customer micro-segments are actually causing your return problems. More importantly, it distinguishes between different types of problems:
Without this micro-segment clarity, managing and processing returns becomes a one-size-fits-all problem. With it, each segment of e-commerce returns can be approached with precision.
Transitioning from discovery to business impact means translating micro-segments into operational tactics. Below are three real-world examples:
A data science team at a mid-market retailer identifies the 15 most significant return-driving micro-segments. They then collaborate with the product, merchandising, and ops teams to translate these into interventions:
In dotData Feature Factory, the data science team creates a reusable pipeline that re-runs monthly to identify emerging patterns or shifts in return drivers. As new customer cohorts enter the system or seasonal patterns emerge, the leaderboard auto-updates, allowing the team to stay ahead of evolving return behaviors.
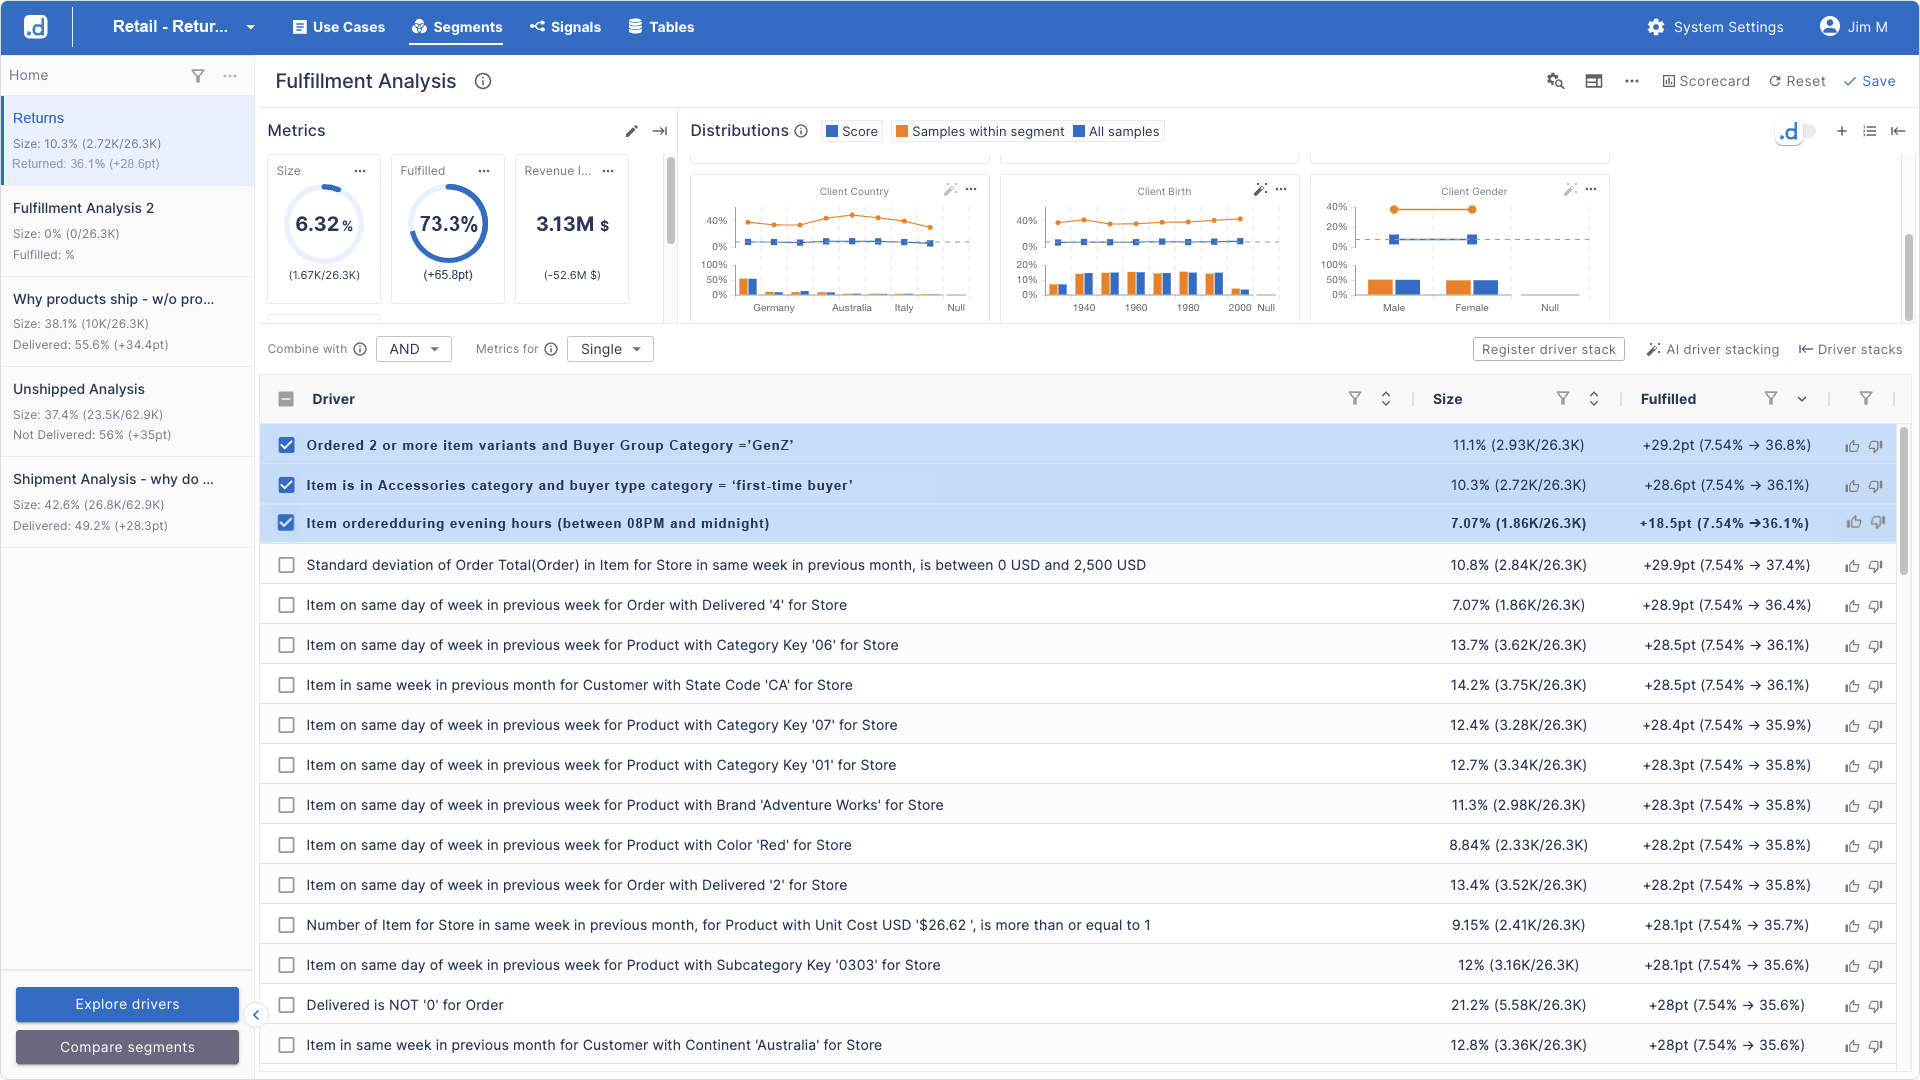
A merchandising team receives curated micro-segments from their data science counterparts through dotData Insight, which translates complex features into business drivers. No coding required—just an intuitive interface showing which business factors predict returns.
A merchandising manager logs into Insight and immediately sees:
She can click on any driver to dig deeper: Which products within accessories? What time of week? What are the AOV patterns of these customers?
Using Driver Stacking—a feature allowing the manager to layer multiple business drivers together—she discovers that combining three drivers creates a hyper-specific micro-segment:
This micro-segment represents just 6.3% of sales but shows 73% returns. For this group, the team decides to implement a specific intervention: a 24-hour post-purchase engagement SMS confirming fit/ customer satisfaction, with an easy exchange option (vs. full return).
The ROI calculation is straightforward: 0.8% of volume, a 48% return rate, and a 3-5% conversion lift to exchanges result in a specific margin impact for a precisely targeted micro-segment.
The most sophisticated retail organizations combine both approaches: data scientists in Feature Factory uncover novel, complex patterns; business teams in Insight operationalize those discoveries and monitor results.
A data science team discovers an unusual pattern: many customers with two or more support interactions within 30 days of their first purchase in specific product categories exhibit a 45% rate of return, compared to a 12% baseline. This seems counterintuitive. Customers who are engaged often have higher retention rates, and this pattern is statistically significant. Further investigation reveals that these clients are contacting support because they have doubts about the product’s fit or functionality before completing a purchase. With the uncertainty resolved, they complete the purchase, but then experience buyer’s remorse after the purchase because the product ends up not meeting customer expectations they developed during their pre-purchase research.
The intervention: operations begins routing these high-engagement pre-purchase customers to a specialized onboarding team that provides extra context during the sales process, effectively converting pre-purchase uncertainty into more confidence after purchase—result: a 35% reduction in returns for this micro-segment.
This kind of discovery—uncovering not just what predicts returns but why—becomes possible only when automated feature discovery surfaces non-obvious patterns that human intuition would never hypothesize.
The financial opportunity is substantial. Consider a mid-market online retailer with $60M in annual revenue:

For a mid-market retailer, even Scenario B (the most achievable) represents a 0.9-1.2% increase in margin revenue. For a $500 million retailer, that’s $5-6 million annually.
The discovery process—identifying micro-segments—is a starting point, not an end state. The deeper value emerges from continuous monitoring.
As market conditions, customer cohorts, and seasonal patterns shift, the micro-segments that drive returns change. Offering features that were critical in Q1 might become less vital in Q3 as new behaviors emerge. Feature Factory’s continuous re-evaluation capability addresses this by automatically re-running the discovery pipeline on new data, generating updated leaderboards that track which patterns remain predictive and which have lost power.
For analytics teams, this updated leaderboard is a diagnostic goldmine. It directly answers the question: “Why did our return rates shift from 24% in Q2 to 26% in Q3?” By comparing the Q2 leaderboard to the Q3 leaderboard, they might discover:
This suggests a story: either the acquisition strategy shifted (bringing in more discount-channel customers) or Gen Z behavior changed (resulting in fewer BNPL users or different purchase patterns). Either way, the leaderboard provides the diagnostic signal, allowing teams to adjust strategy proactively.
For retailers considering this approach, the implementation roadmap is straightforward, but it requires clarity on the data prerequisites.
In an industry where 24.5% return rates represent the accepted norm, retailers that use micro-segment discovery gain a structural advantage. They’re not managing a global return rate; they’re working 15-20 distinct micro-segments, each with tailored interventions.
The question isn’t whether $850 billion in annual returns is inevitable. It’s whether those returns are evenly distributed across your customer base—or concentrated in specific micro-segments you haven’t identified yet. The answer to that question, discovered through systematic feature engineering, determines whether returns remain an uncontrollable cost center or become a precisely managed lever.
The retailers moving fastest are already doing this. The question for everyone else is whether they can afford not to.
The paradox is that the high, aggregate return rate (e.g., 24.5% online average) is an illusion. The real margin destruction is caused by a small number of customer micro-segments with highly divergent return rates, which are hidden within the average.
Traditional Business Intelligence (BI) tools only analyze predefined segments (e.g., by product or channel). They are incapable of systematically testing the thousands of complex combinations of customer behaviors (micro-patterns) that truly predict high returns of future purchases.
High-risk, low-margin segments include “First-time buyer + BNPL payment” (up to 52% return rate), “Paid social acquisition + discount code + mobile device” (up to 45% return rate, nearly half), and “Plus-size fashion + low size guide engagement” (up to 38% return rate).
Feature engineering is the automated process of testing all feasible combinations of customer data (age, payment method, browsing time, channel, etc.) to systematically discover and rank the non-obvious micro-patterns that are most predictive of ecommerce returns.
Retailers plan to replace one-size-fits-all policies with precise, targeted interventions, such as: prompting better sizing help for “fit-uncertain” shoppers, adjusting return program and ecommerce return policies to retain high-CLV customers, and implementing precise fraud detection protocols for wardrobing micro-segments. This not only helps cut costs of returns but also enhances customer satisfaction and customer experience.