Auto Loan Delinquency at a Record: The State of Auto Finance, H1 2026
- Industry Use Cases
 dotData
dotData
dotData
Getting a real read on auto credit means pulling data from at least six places — New York Fed household debt data, TransUnion and Experian delinquency tapes, NCUA credit union filings, Cox Automotive collateral values, CFPB supervisory reporting — and reconciling them by hand. Most risk and lending teams don’t have a quarter’s worth of time to do that before the next period starts.
We did it for you. This article is our first analysis that pulls those sources into a single resource, so your team isn’t chasing multiple logins, multiple PDFs, and multiple analyses to answer one leading question: Is the portfolio getting riskier, and where? Here’s what the second quarter (Q2) 2026 data shows:
On the surface, household debt seems to be under control. Total consumer debt in the U.S. was $18.8 trillion in the second quarter, and the employment situation for higher-income borrowers remained solid enough to keep aggregate figures from fluctuating. In contrast, the auto lending sector indicates a different trend as auto loan delinquency issues grow.
Outstanding auto loan balances hit a record $1.71 trillion in Q2, up $28 billion for the quarter — even as the number of active auto loan accounts fell to 79.3 million, down 1.24% from a year earlier. The market is growing, but mainly because the cars, and the loans against them, cost more dollars.
High vehicle prices, still-elevated interest rates, and three years of cost-of-living inflation have changed the math on every transaction. Lenders are putting more capital behind a shrinking pool of borrowers, which means every default now carries a bigger price tag.
The average consumer now carries $25,219 in auto debt, up 7.31% cumulatively over three years. New vehicle loans average $43,610, with monthly payments running a record $765 at 6.35% APR. Used vehicle loans average $27,852, at $542 a month and 11.19% APR.
To keep those car payments manageable, lenders have leaned hard on longer terms. More than a third of new vehicle loans (35.6%) and used vehicle loans (33.3%) now run past 72 months. That keeps the monthly bill down, but it also flattens the principal paydown curve — borrowers can sit underwater for a long time, often four to five years. When something goes wrong financially in years two through four, such as a spike in unemployment, there’s often no equity left to sell out of, so delinquency and default becomes the only exit.

The lender mix shifted meaningfully this quarter. Commercial banks came back into auto finance aggressively as deposit costs settled down, and now hold 27.15% of total market share.
Captive finance arms — the lending units run by automakers — pulled back. Their overall share declined to 26.26%, and in new vehicles specifically, captive share fell to 52.39%, down 952 basis points from its 2024 peak of 61.91%. Automakers have been cutting subvention programs and 0% APR deals to protect margins under tariff pressure.
Credit unions held steady at 20.38% of originations. Their auto loan book shrank slightly to $479.6 billion, but they still dominate refinancing, writing 68.33% of all refinance volume. Borrowers who refinanced through a credit union saved an average of $102 a month.

Gas prices crossed $4.00 a gallon this quarter after a round of geopolitical oil disruptions, and that reshaped what people are financing — but not in the direction you might expect.
Hybrid financing jumped to 16.80% of new vehicle loans, up from 12.99% a year ago, and hybrids now carry the lowest average payment of any powertrain at $646 a month, versus $721 for gas vehicles. Pure EV financing actually shrank, down to 8.15% of new loans from 9.21% a year ago, following changes to tax incentives. EV payments also run higher, averaging $692 a month, and a wave of lease returns hitting wholesale channels means EV values are exposed to further depreciation once fuel prices settle back down.
Credit stress isn’t confined to subprime anymore, and consumer delinquency rates are rising across the board. Roll rates are climbing in near-prime and prime tiers too.
Auto loan delinquency rates for accounts 90+ days past due reached 5.6% in Q2 — above the 5.05% level seen at the start of the pandemic, and the eleventh straight quarter of deterioration since the cycle bottomed out at 3.73% in Q4 2022. Experian’s 30-day delinquency rate rose to 2.39% from 2.32% a year ago, and the 60-day rate increased to 0.90% from 0.87%. Fewer of these early-stage missed payments are curing, because borrowers have less savings left to draw on when they fall behind and are unable to pay on time.
Defaults are also happening earlier — increasingly within the first 6 to 12 months of the loan. J.D. Power now classifies 29% of auto finance customers as financially vulnerable, which puts more weight on front-end verification at origination to protect the overall health of the portfolio.
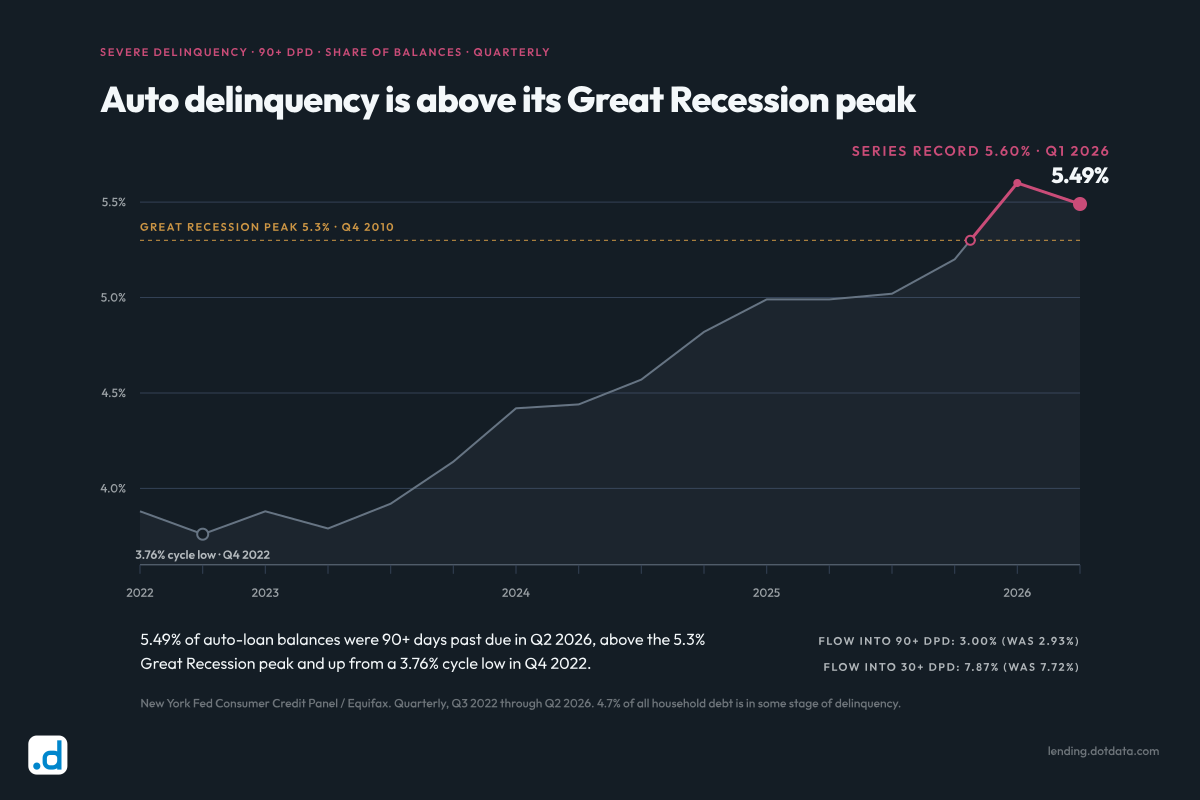
During the inventory shortages of 2021-2022, auction recovery rates peaked at up to 80%, allowing lenders to manage defaults with minimal cost. As recoveries have stabilized near 50% to 55% of outstanding principal, the financial buffer has disappeared.
Here’s what that looks like on a $20,000 default at 55% recovery:
| Amount | |
|---|---|
| Gross balance | $20,000 |
| Auction proceeds | –$11,000 |
| Repo & recon fees | +$1,500 |
| Net write-off | $10,500 |
| Loss severity | 52.5% |
That severity is enough to break the subprime pricing model. Subprime loans carry an attractive headline yield of 19.42% APR, but once you net out the real costs, the return disappears:
Lenders writing subprime paper today are, in many cases, earning less than their own cost of capital. Deep subprime loans repossess at rates up to 16.6 times higher than prime, and most of the interest yield gets eaten by servicing and write-offs before it ever reaches the bottom line.

A few adjustments matter more than others in a cycle like this one:
This is a fraction of the picture. The full Q2 2026 report includes eighteen readings across market structure, borrower and portfolio performance, and collateral and loss — all six sources, already reconciled, with the strategic frameworks attached. Download the full report instead of pulling the sources yourself to add these insights to your risk management process.