
How to Evaluate Lending Analytics: From Origination to Charge-Off
- Industry Use Cases
As 2025 drew to a close, the auto lending industry had seen some significant shifts in risks. Delinquencies for subprime auto loans of 60 days or more reached a record high of 7.06%, and even in the prime segment, borrowers 30-plus days delinquent reached 2.17%, a level not seen since the 2008 financial crisis. An even greater threat has also attacked the lending community, with an estimated $3.3B in exposure across lending due to the rise in the use of synthetic identities. Traditional risk scorecards—blunt statistical instruments calibrated during periods of prolonged economic stability—are actively deteriorating in this environment. When these static logistic regression models encounter the realities of current market volatility, they create severe blind spots, routinely generating errors exceeding 20% between projected and actual portfolio losses.
The margin for error in auto lending operations has effectively reached zero. Lenders who rely on legacy data analytics processes face two stark realities. First, a new wave of more sophisticated fraudster networks is actively targeting the auto lending industry; second, the same lenders are bypassing potentially high-yield borrowers due to overly rigid and outdated underwriting policies and rules. To profitably expand their market share, Chief Risk Officers (CROs) and Chief Lending Officers (CLOs), along with their data science team, must systematically evaluate their lending analytics infrastructure and its use across the entire credit lifecycle.
A new approach is required that augments existing capabilities by identifying gaps in current systems and processes, using artificial intelligence to perform deep pattern analysis and uncover high-value patterns in raw relational data.

How you approve loans (origination) decides if they are high-quality or risky, and whether you will make money on that specific batch (vintage) of loans in the long run. Making a bad decision during origination sets off a snowball effect of increasing credit risks that appears when loans become delinquent or need to be written off. Evaluating lending analytics at origination means moving beyond simple approval rates to understand the complexities of adverse selection, dealer behavior, and the friction of the manual lending process.
Legacy logistic regression models can easily misclassify niche consumer groups, such as thin-file applicants, as “universally” high risk. The inability of the lending analytics process to delve deeper without excessive manual intervention forces lenders to reject potentially high-performing applicants, effectively handing high-yield market share to competitors with greater risk tolerance or those that can more accurately price that specific risk. Legacy models approve loan applicants that appear safer on paper, but carry hidden behavioral risk, while rejecting applicants who appear risky but actually exhibit stable financial behavior.
Conversely, these same static models routinely fail to detect highly engineered synthetic identities. In fact, fraudulent auto loan applications made up more than 3% of applications in the first half of 2025, spiking to more than 5% during coordinated, multi-lender attacks. Synthetic identity fraud hits auto lending especially hard due to the asset’s high principal value. Synthetic borrowers who default are immune to traditional tactics such as skip tracing and repossession because the individual who opened the account does not actually exist. The financial impact of these analytical failures alters the risk-to-reward calculus of the entire portfolio.
| Consumer Risk Tier | Average Synthetic Fraud Loss (Auto) | Unsecured Personal Loan Average Loss | Credit Card Average Loss |
|---|---|---|---|
| Super Prime | $53,796 | $21,483 | $14,785 |
| Prime Plus | $25,363 | $17,416 | $6,985 |
| Prime | $22,421 | $8,657 | $3,025 |
| Near Prime | $23,135 | $4,998 | $906 |
| Subprime | $16,015 | $1,756 | $346 |
Data reflecting average fraud losses by product and risk tier.
A 1% reduction in false positives at origination translates directly into millions of dollars in operational cost savings and avoided principal losses. The analytics infrastructure for credit risk management must be able to distinguish genuine thin-file applicants from synthetic profiles fabricated by organized crime rings.
To evaluate lending analytics effectively at the point of decisioning, risk leaders must track highly specific Key Performance Indicators (KPIs) that reveal operational friction and the ingestion of systematic risk.
Book-to-Look Ratio The Book-to-Look ratio tells lenders how many approved applications actually turn into funded loans. When that number dips, it’s often a sign that the process is turning dealers off—usually because it’s too demanding. If lenders ask for piles of paperwork like pay stubs, W-2s, or utility bills, dealers won’t wait around. They’ll just take the deal to someone who can fund it faster. High-stipulation environments guarantee that the lender loses the “Dealer’s Choice” battle in the indirect channel. Advanced analytics can help lenders identify stipulation proxies by analyzing credit bureau data. For instance, if a borrower has a history of holding a mortgage, that alone can serve as strong, AI-backed evidence of their creditworthiness and income stability. Applying these types of proxies allows the lender to automatically waive manual stipulations, accelerate funding times, and achieve preferred lender status without increasing the underlying default probability.
First Payment Default (FPD) by Dealer. First Payment Default is the biggest symptom of origination failure. Up to 70% of early-payment defaults show evidence of misrepresentation or fraud in the initial application. Tracking FPD at the dealer level separates systematic risk from risk arising from changes in market conditions. If a dealer’s FPD rate varies from the regional mean by a pre-determined metric, the analytics engine should flag the dealer and submit it for review. Dealer risk, such as repeatedly inflating vehicle values (known as power booking), using fake employer databases, or submitting falsified income data, can increase a lender’s default risk for that originator by up to 500%.

For data science teams operating within captive or large auto lenders, relying on one-size-fits-all variables is insufficient to detect modern fraud patterns or to distinguish high-risk from creditworthy thin-file borrowers. Systems like dotData provide a programmatic solution for this bottleneck. Feature Factory is a Python-based platform that integrates into the lender’s existing environment and automatically explores thousands, sometimes millions of potential signals by analyzing the complex patterns between ingested data, including alternative credit files, transaction histories, demographic data, and dealer metadata – just to name a few. dotData identifies complex behavioral signals, such as temporal signals that measure variance in average bank balances before a scheduled payment, that provide predictive lift measured in hundreds of basis points over standard FICO scores. This automated discovery of complex patterns isolates the variables that human data scientists routinely miss due to time constraints and cognitive limitations.
For analytics leaders, pricing committees, and business executives managing dealer relationships, because of its ease of use, dotData Insight makes it easy for business leaders to identify complex mathematical relationships and convert them into actionable plans backed by verifiable, transparent signals. Business intelligence professionals use the Driver Discovery platform to analyze the relationship between a KPI, such as 90 days past due (90DPD), and the underlying credit data. The system presents Business Drivers—such as “vehicle model is 4Runner”—and instantly calculates the percentage of historical records that match the driver, along with the exact positive or negative lift on the target KPI.
Furthermore, analysts can perform Driver Stacking. By combining multiple drivers—for example, “Records with Account Type ‘SEC CREDIT CARD’ in tradelines in the last 2 years” stacked with “Records with Account Type ‘EDUCATION LOAN'”—the system computes the exact mathematical impact, creating a specific micro-segment. This allows executives to turn a safe “no” into a profitable “yes” for specific micro-segments.
As soon as a lender funds and books a loan, the focus quickly shifts to monitoring portfolio health and staying on top of regulatory compliance. In 2024 and 2025, the consumer credit landscape started to look very different. While super-prime borrowers were largely unaffected, subprime and near-prime borrowers faced increased pressure from inflation, the resumption of student loan payments, and rising vehicle costs. ML models developed using historical data cannot adapt to such rapidly changing conditions and require ongoing portfolio monitoring.
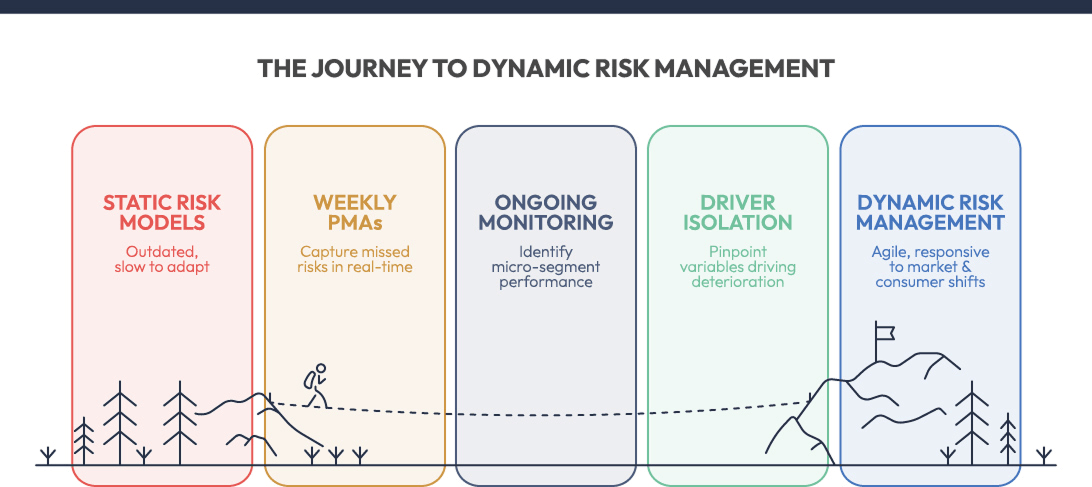
Risk models and scorecards begin to decay the instant they are pushed into production. Even the largest lenders will update models and scorecards only every six to twelve months. With such lengthy redevelopment cycles, the portfolio becomes exposed to economic shifts and changing consumer behaviors. When such shifts occur, the baseline probability of default changes. Lenders need to course-correct using weekly Post-Model Adjustments (PMAs) to capture risks that the primary static scorecard misses. Continuous monitoring of signals enables risk managers to identify overperforming and underperforming micro-segments in near real-time. If a specific loan vintage originated in Q1 and begins to exhibit unexpected stress in month four, the lender should be able to automatically isolate the variables driving the deterioration. This allows the pricing committee to pivot origination strategies instantly, tightening knockout rules for that specific profile to protect the remaining capital and prevent the stress from ruining a subsequent vintage.
The Consumer Financial Protection Bureau (CFPB) has become more aggressive in its oversight of the auto lending industry, focusing especially on algorithmic transparency, fair lending violations, and hidden consumer fees. The revised regulatory framework no longer tolerates black-box models in which the logic behind a credit denial is unexplainable and unauditable. CFPB’s Circular 2024-06 requires that lenders that use complex algorithms for credit decisions must provide accurate and specific information regarding loan denials. A lender cannot legally decline an auto loan based on a neural network’s output and supply a generic “purchasing history” denial code. The exact attributes that drove the decision must be transparent, explainable, and demonstrable to examiners.
In addition, the CFPB’s ongoing campaign against “junk fees” also requires lenders to monitor their portfolio performance for pricing complexity that disproportionately harms protected classes. The FTC’s Compliant Auto Retail Scams (CARS) rule targets unfair or deceptive practices related to add-on products or a lack of transparency in pricing. If an algorithmic pricing model penalizes a demographic group through complex sub-pricing, extended warranties, or unconstrained dealer markups, the lender can face severe impact liability and potential enforcement actions.
Monitoring segment-level profitability ensures that the institution is accurately pricing for risk. However, this must run concurrently with stringent Fair Lending metrics. Data analytics teams must continuously calculate the Adverse Impact Ratio (AIR) and the Standardized Mean Difference (SMD) across all protected classes. If the analytics engine identifies a highly profitable micro-segment but relies on variables that are strong proxies for race, gender, or age, the risk of regulatory penalties eliminates any financial gain. Ongoing loan monitoring assures that the data signals utilized for Post-Model Adjustments remain compliant with the Equal Credit Opportunity Act (ECOA).
Keeping an eye on how fast approval rates move away from their baseline gives lenders an early warning signal that their models may be drifting. If approval rates for a given credit tier suddenly drop by around 15% from one week to the next, it’s a strong sign that something has changed in the underlying applicant pool. In many cases, this means the data profile of new applicants no longer aligns with the historical datasets the risk team used to train the model. By monitoring this “velocity,” lenders can avoid accidentally booking bad paper or shutting out creditworthy borrowers during periods of rapid economic change.
The strict regulatory requirement for explicit algorithmic transparency makes dotData Feature Factory an essential deployment tool for data science teams operating in highly scrutinized environments. Rather than outputting a black-box deep learning model that cannot be audited, the platform utilizes patented Statistical AI to rank the strongest, most predictive features while maintaining total transparency.
Crucially, the to_sql() method automatically produces the exact SQL code necessary for feature generation. This output provides the exact mathematical logic for every variable used in the final model, ensuring that the model operating in production is identical to the model built in R&D. The ability to provide transparent, easily reproducible code creates a “glass box” environment that is friendly to regulators. Underwriters can access the platform’s leaderboard view to review AI-discovered signals and identify areas of overestimated – or underestimated – risk. Through a human-in-the-loop approach, lenders can ensure compliance with Fair Lending regulations while maintaining the significant predictive lift provided by automated signal discovery.
As a lender’s portfolio matures, changing economic realities put pressure on borrowers. As a borrower’s ability to stay current becomes increasingly less stable, the statistical likelihood that a 30-day past-due (DPD) account will become current declines with each passing week. Relying on basic aging reports to manage this phase only results in decreasing operational efficiency and additional losses.
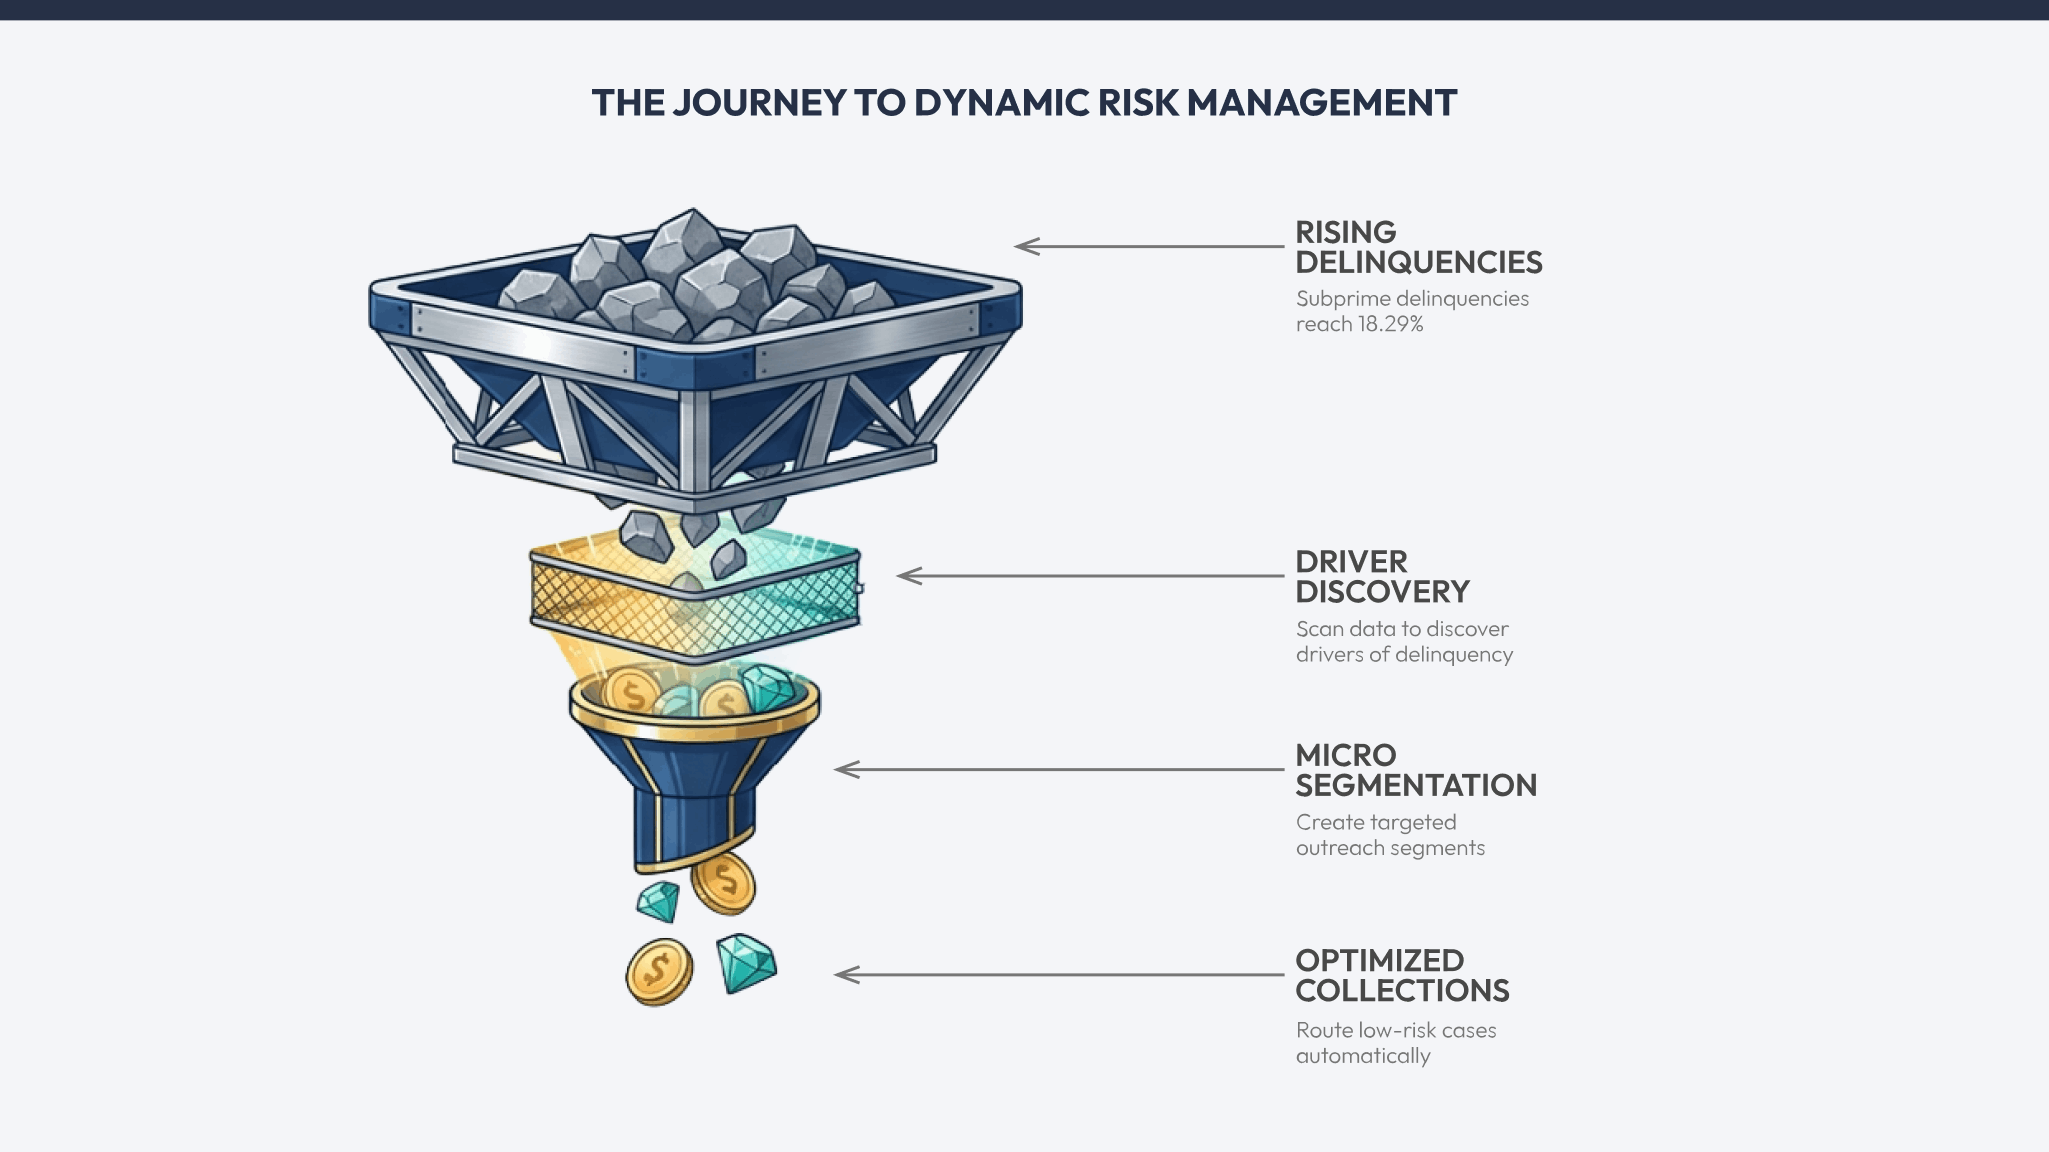
By late 2025, subprime 30-plus-day delinquencies reached 18.29%, while prime 30-plus-day delinquencies hit 2.17%. This steady climb in average auto loan delinquencies means lenders need to evaluate lending analytics accurately, not only at origination but also during the loan servicing phase. Doing so means institutions must be able to delve deeper into their delinquency pipeline to distinguish temporary liquidity gaps from likely defaults.
A primary challenge in current auto finance servicing is managing the “intentional skip.” This event occurs when a borrower deliberately defaults on a loan payment and actively attempts to conceal their physical location and the vehicle to avoid repossession. While some borrowers face genuine, unexpected financial stress due to job loss, medical emergencies, or inflationary pressures, a growing subset never intended to repay their loans from the start. Uncovering whether the hardship is actual or likely intentional is critical in determining whether the collections department should offer a low-cost forbearance plan or immediately initiate expensive skip-tracing and repossession procedures.
Roll Rate Velocity (30-to-60 DPD) The roll rate measures the precise percentage of accounts that migrate from one delinquency bucket to the next (e.g., from 30 days late to 60 days late) during a specific reporting period. Roll rate velocity tracks the acceleration or deceleration of this specific migration. A lender with a 30 DPD bucket with $80 million in active loans might have a historical 30-to-60 DPD rate of 22%. An unexpected jump to 25% means an additional $2.4 million has moved into a higher-risk state. Analytics platforms must monitor roll rates at a granular level—by specific dealer originator, geographic region, and loan term length—to pinpoint the source of deterioration and execute targeted interventions.
Cure Rate: Cure rate looks at the flip side, measuring the percentage of delinquent accounts that are brought back to current status without rolling into the next stage of delinquency. Evaluating this rate helps risk officers understand how effective their early-stage collection efforts really are. For example, if a credit union launches a new digital outreach program to help borrowers who are 15 days past due, tracking the 30-day cure rate provides clear evidence of whether the program is actually keeping accounts from sliding further into default or merely using valuable operational resources.
Cost Per Dollar Collected (CPDC) is an operational KPI that divides total collection expenses (including vendor costs, headcount, and technology infrastructure) by the total dollars successfully recovered. As collections operations shift from brute-force, labor-intensive call centers to technology-driven, omnichannel solutions, CPDC measures the true return on investment of the servicing analytics. If the CPDC rises while overall recovery amounts remain flat, the analytics targeting model is likely prioritizing the wrong accounts—expending expensive manual resources on borrowers who will self-cure regardless of intervention, or wasting time on intentional skips who have zero probability of voluntary repayment.
The application of dotData Insight in the servicing department fundamentally alters how collection resources are allocated and deployed. A lean business intelligence team can analyze a specific target variable—such as “Probability to Roll to 60+ DPD”—and utilize Driver Discovery to scan millions of demographic and behavioral data points associated with the delinquent accounts.
The system might uncover a specific business driver, such as: “Borrowers with a prior history of paying off education loans early are 40% more likely to self-cure when given a 10-day grace period.” It might also reveal that accounts tied to certain subprime credit card tradelines have an 80% chance of rolling to charge-off. By stacking these kinds of drivers, collections managers can combine multiple signals to build small, highly targeted micro-segments for outreach. Profiles that match behavior signals associated with intentional skips can be routed quickly for aggressive recovery paths. At the same time, low-risk hardship cases are routed through automated workflows, reducing the cost per collar collected.
When early-stage mitigation efforts fail, and an account reaches terminal delinquency, the asset must be forcefully recovered and liquidated at auction. The ultimate financial loss incurred during this phase is not static; it depends heavily on the collateral’s physical value and the broader macroeconomic environment shaping wholesale market dynamics at the exact moment of sale. Portfolio analytics at this stage requires precision in depreciation forecasting and loss estimation.

The vehicle’s residual value determines the final cost of a defaulted auto loan when the vehicle is auctioned. Throughout 2024 and 2025, used-vehicle values varied widely, driven by supply chain shifts, evolving tariff policies, and fluctuating demand for EV vehicles. The Manheim Used Vehicle Value Index (MUVVI) captured this instability: while it closed 2025 at 205.5—a marginal 0.4% increase over the previous year—this flat result masked a series of dramatic intra-year price swings. For lenders, this volatility has rendered traditional residual value forecasting obsolete; static models fail to account for these rapid fluctuations, routinely leading to actual recovery losses that deviate by more than 20% from initial projections when collateral is liquidated during a sudden market trough.
Pricing fluctuations affect the Loan-to-Value (LTV) ratios. After vehicle prices softened from their pandemic-era highs, millions of borrowers suddenly found themselves underwater on their auto loans. Nearly 25% of trade-ins on new-vehicle purchases now carry negative equity. When these types of heavily leveraged loans default, the gap between the outstanding balance and the potential auction value widens. The widening gap between balance and vehicle value has driven recovery rates for subprime auto loans to 33.88%, the lowest since 2007.
Loss severity is the ultimate reality check for any auto loan performance. Loss severity shows what remains once a vehicle is repossessed, auctioned, and all related fees are accounted for. When the gap between actual loss severity and projected residual values widens, it’s a clear sign that valuation models are falling behind. Lenders can’t afford to rely on broad, outdated forecasts. If real-world losses continue to exceed estimates, it’s time to recalibrate models with more detailed, up-to-date market data to protect margins.
Essentially, the Net Charge-Off Rate tells you how much debt is truly gone—it’s the uncollectible portion of a portfolio expressed as a percentage. By tracking this rate across different vintages and credit tiers, you can assess whether your original underwriting was accurate. If a specific vintage shows a spike in charge-offs, it’s a clear sign the funding model underestimated the borrower’s real-world risk.
To systematically evaluate the lending analytics ecosystem across the entire enterprise, Chief Risk Officers and VPs of Lending must plot their current operational capabilities against a structured maturity framework. This path from basic, reactive operational reporting to autonomous, AI-driven strategy execution spans three distinct stages. It dictates whether a financial institution merely reacts to financial losses after they occur or actively prevents them before they materialize.

Descriptive analytics helps to understand “what” happened. Dashboards and reports represent the foundational tier of data maturity, characterized by static reporting, retrospective dashboards, and manual data aggregation.
Predictive analytics answers the question, “What is likely to happen?” Institutions use advanced, mostly manually coded, statistical models and machine learning algorithms to forecast future trends and anticipate specific outcomes based on historical patterns.
Statistical AI leverages machine learning to discover patterns in complex data under predefined conditions. For example, a lender might want to understand why a subset of loans that had been scored as “low risk” by their scorecard or model nevertheless became delinquent.
Lenders no longer possess the margin of error they once had. The combination of peak subprime delinquency rates, the increasing sophistication of fraud networks, and increasingly strict regulatory enforcement by the CFPB means lenders need a data infrastructure that enables an agile framework. Institutions still relying on status scorecards, retrospective reporting, and ML models without a strong Post-Model Adjustment strategy will continue to fall behind their competitors, funding loans that their technologically advanced counterparts reject or missing on the ones they fund.
Evaluating the lending analytics process is not simply an “IT project” or an annual exercise aimed at satisfying compliance requirements. Instead, it’s an ongoing process spanning the full lifecycle, from dealer submission to the auction block. With advanced signal discovery automation and driver stacking, risk leaders can permanently find blind spots in their portfolios. This transition converts raw, complex relational data into a sustained, highly resilient competitive advantage, ensuring profitability regardless of macroeconomic volatility.