A Diagnostic Framework for Lender Protection
- Industry Use Cases
While a national index like the Manheim Used Vehicle Value index can serve as a gauge of broad market direction, it can also obscure year-over-year swings and regional and seasonal patterns. Modern lending analytics platforms must allow lenders to easily identify the seasonal, regional, or even brand-specific micro-patterns that can drive margin. Relying on national averages means ignoring the hard-to-find signals of price volatility that can drive unexpected outcomes for vehicles sold at auction.
The Chief Risk Officer (CRO) typically reviews a year-end index report that might show a marginal 0.4% increase — a report that implies stability. Such a high-level view can hide risky trends and patterns in a portfolio with regional exposure. While the index shows a flat trend, the recovery team might report a 20% variance in auction proceeds across different state lines.
At the end of 2025, the Manheim index closed the year with a small increase of 205.5, showing stability in used-vehicle values. In March of the same year, however, the index had declined sharply to 202.6, a drop that shows that while national averages are useful for monitoring trends, they can also hide periods when values fall faster than expected. For lenders, it’s important to remember that while used vehicle values are expected to grow at a reasonable 2% rate in 2026, there will still be differences due to seasonal, regional, or even brand-driven factors.
Relying on broad predictions can create blind spots to important details. A 0.4% shift in an index—something people used to write off as just noise—can actually hide real problems with wholesale vehicle values. That’s why you need to take a closer, more analytical look if you want to spot residual value risk.
Signal Intelligence can act as an early-warning system for risk strategy, a “radar” that gives executives a clear view of how changing vehicle values affect different regions, often before recovered vehicles reach auction. When lending institutions spot these trends early, they can adjust disposal strategies and achieve better returns when it needs to be liquidated.
For the practitioner, the signal discovery engine automatically identifies Residual Value Risk patterns. It analyzes thousands of vehicle trim and mileage combinations to find the specific drivers of depreciation. This replaces manual analysis that often takes weeks to complete.

The widening gap between loan balances and wholesale vehicle values means the financial impact of each default grows. Higher LTVs at origination mean that, even with stable recovery rates, loss severity increases when vehicles must be liquidated. The deficit caused by the gap grows the deficiency balance that must be charged off.
The “underwater” borrower is now a significant driver of portfolio risk for all lenders. In the final quarter of 2025, 29.3% of all trade-ins were for borrowers with loan balances that exceeded the trade-in vehicle’s value. Each month, nearly a third of trade-ins enter a lender’s portfolio with a built-in deficit.
The underwater borrower is not a simple pricing challenge for the origination team; it reveals a liability that traditional scorecards were not designed to account for. Each of the nearly 30% of underwater loans means a potential hit to ROA that can be easily ignored until an account becomes delinquent.
A regional lender recently discovered that a segment of presumed “safe” prime borrowers was actually underperforming. A combination of high LTVs, rapid vehicle depreciation, and high-mileage assets meant that the lender’s recovery proceeds would not cover the principal. Even as prime auto loan recovery rates reached 54.46% in January of 2026, the net loss per unit has remained elevated.
Signal Intelligence can be a powerful tool in the battle against negative equity. Micro-segmentation using all available data can build powerful safety nets to identify high-depreciation assets with far greater detail and precision than static historical tables.
Financial institutions can use Signal Intelligence to bridge this negative equity gap. Pricing strategies should be adjusted based on real-time signals of asset depreciation rather than on static historical tables. This makes it easier to align the risk premium with the specific type of collateral and its expected market performance.
Practitioners can automate the discovery of signals linking pricing basis points (bps) to underperforming vehicle types, with a level of granularity that enables the creation of rules to identify (for example) specific model years that are more likely to result in a higher loss rate. A high level of precision protects the P&L from predictable yet often undetected failures in collateral value.

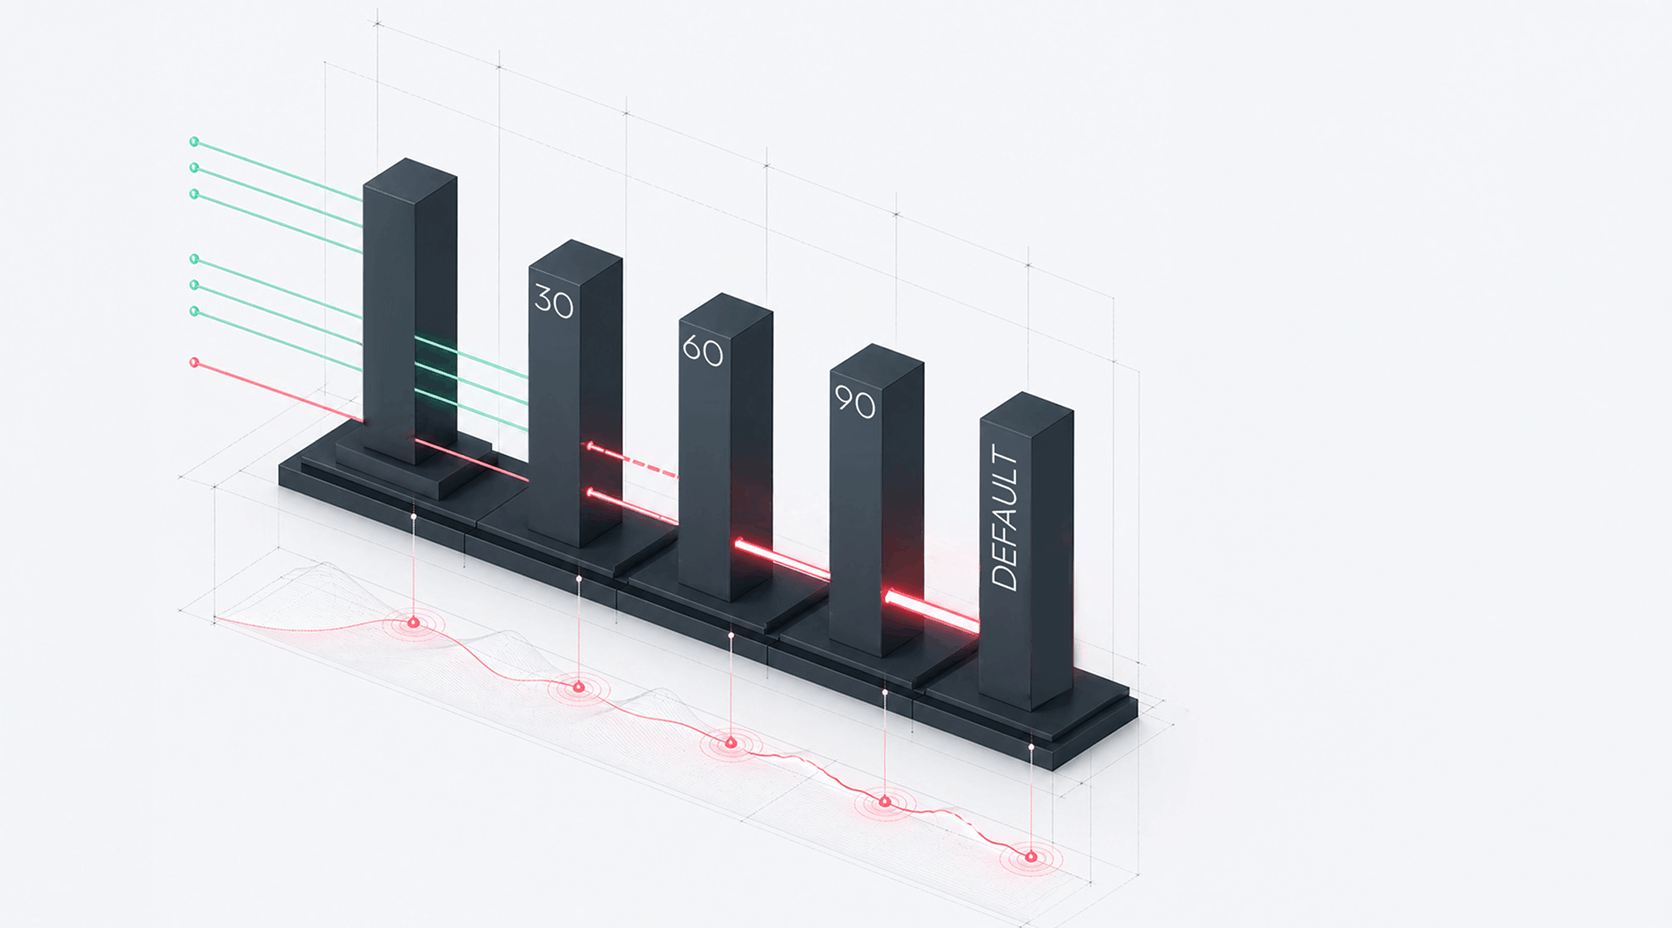
The speed at which a loan moves from 30-day delinquency to a 90-day state is the most important leading indicator of a likely loss. Tracking the velocity of stage-to-stage movement (the roll rate velocity) enables lenders to execute mitigation strategies before the net charge-off rate spikes. Once a loan reaches 90 days past due, recovery options are severely limited.
In a portfolio where the delinquency percentage appears stable on a monthly dashboard, the portfolio might still be experiencing an accelerating migration from Bucket 1 to Bucket 2. The roll rate velocity is the most reliable predictor of future charge-offs.
By the time a charge-off happens, the opportunity for a “work-out” plan has passed. Your data is likely telling a story of an impending loss, but legacy tools only show you the summary. They can miss the temporal signals that indicate a borrower is failing to meet their monthly payment requirement.
The Federal Reserve reported that the net charge-off rate for auto loans reached 11.3% in Q4 2025, significantly above the long-term average of 0.70%. Even more troubling, 60+ day delinquencies reached 1.49% in early 2025, surpassing the 2009 post-credit-crisis peaks.
Annualized losses for subprime auto loans reached 10.06% in January 2026, while 60-day delinquencies hit 6.78%. Both figures indicate a growing roll-rate velocity problem that traditional models cannot account for. A portfolio built on static rules will always be 60 days late to an actual risk event.
Signal Intelligence monitors roll rate velocity across the entire portfolio to protect ROA. It acts as a diagnostic layer that identifies “payment gap” patterns. These are hidden temporal features indicating a borrower will soon roll into terminal delinquency.
For example, a borrower might keep paying 10 days late for three months straight, then suddenly skip a payment. A legacy system assumes the loan is either “current” or “30-day late.” Still, a signal discovery system sees more—it combines that payment pattern with other signals, spots a high-velocity risk, and flags it for urgent action.
Asset recovery really comes down to timing and market knowledge. Through vintage analysis, lenders identify which loan segments are most at risk, enabling them to fine-tune when and how they repossess and sell assets. Capturing seasonal spikes in wholesale demand allows lenders to mitigate loss severity significantly.
Subprime recovery rates hit their lowest levels since the Great Recession during the recent market cycle. If your organization treats every recovery the same, you are leaving capital on the auction floor. Precision in liquidation is now essential to maintaining a healthy balance sheet.
In early 2026, subprime recovery rates hit 34.36%, barely budging from the 33.88% lows seen in December 2025, levels not seen since the Great Recession. When asset recovery becomes difficult, it’s time to move from broad averages to surgical precision in recovery efforts.
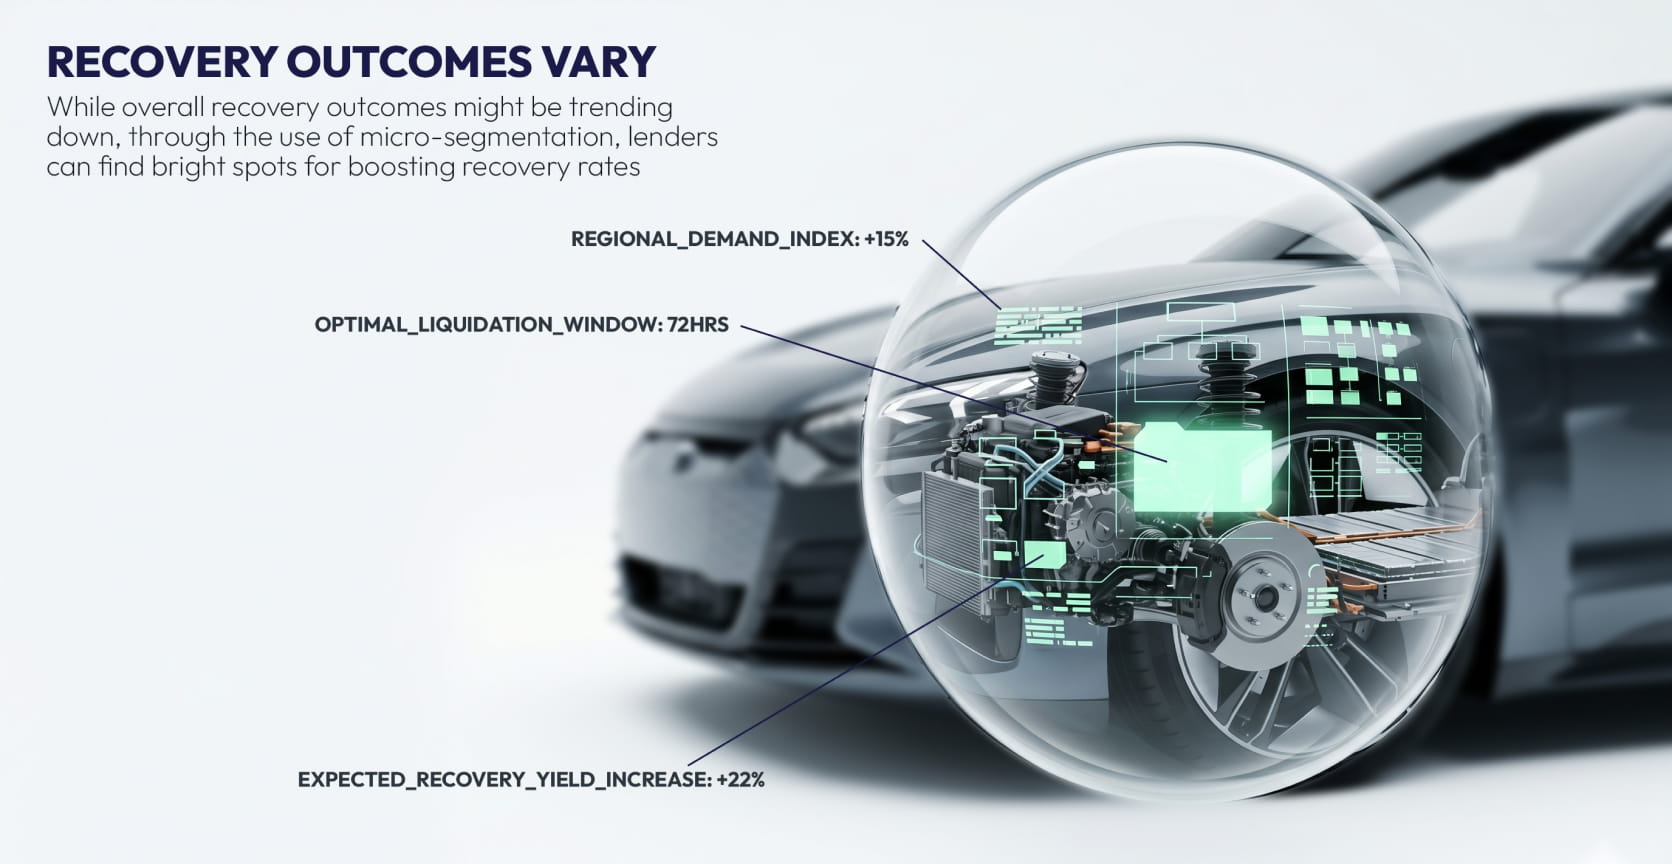
A top-tier auto lender recently improved its recovery outcomes by identifying micro-segments in which loss severity could be mitigated. They found that certain vehicle types sold 15% better at auction when sold in specific regional hubs. They did not need a new team to find these patterns.
The lender used signal intelligence to identify explainable signals that predicted the optimal time to auction an asset, enabling them to prioritize repossessions and auction placements based on real-time market signals rather than long-term trends. The result was a measurable reduction in per-unit deficiency balance.
For business analysts, this means using a smart tool to build more effective “sell-fast” models that account for a vehicle’s condition, mileage, and local market demand. These models provide clear instructions to the recovery team on how to maximize the value of each vehicle.
To address the current portfolio illness, CROs should immediately implement a four-part diagnostic audit.
Check out our microsite dedicated for lenders: https://lending.dotdata.com/
Any evaluation of lending analytics for auto loan charge-offs should focus on the specific reasons for the losses and the differences in recovery amounts, rather than just the bottom-line loss figure. Static models often fall short because they cannot account for rapid changes in collateral values or customer behavior. A robust system should spot drivers of loss at a micro-segment level.
According to recent S&P Global research, the rate stands at approximately 34%, a slight stabilization from the record lows of late 2025. However, the 35% level remains historically low and requires aggressive management of recovery channels.
Negative equity creates a “deficiency gap” that increases the total amount charged off upon default. When 29.3% of trade-ins are underwater, the lender is effectively unsecured for a portion of the loan from day one. This makes the accuracy of loss forecasting even more critical for capital reserves.
Lenders should start adopting multi-source data analysis and data-derived post-model adjustments. It’s also important to reevaluate the frequency of model updates. Relying on annual or biannual refreshes is insufficient in a market with high roll rate velocity. Successful forecasting requires identifying hidden signals across diverse datasets to accurately predict terminal delinquency.