
Margin Compression: NIM Is Up, Auto Spreads Are Down
- Industry Use Cases
 dotData
The October packet for the Asset-Liability Committee (ALCO) has one green line and one that will no longer be green. Although the net interest margin on the balance sheet is stable, the auto product line has lost basis points for two consecutive quarters, and the treasury would like to have a strategy on the agenda before the vote. All lenders pricing auto loans—whether banks, credit unions, captive auto lenders, or independent lending institutions—are looking at some version of that page this fall.
The reflex is raising prices or rates across the entire tier, since tiers are the only thing a rate sheet can adjust. However, a tier averages the borrowers who are compressing the margin together with those who aren’t. When the entire tier is raised, both groups end up paying for a loss that was caused by only one of them.
A rate sheet converts a score into a price, meaning margin escapes an auto book when the score incorrectly identifies certain populations. Indirect books add another stage, since the buy rate includes each scoring error before the dealer is involved. Identify those populations first, then price them, and the tier-wide increase will then be what it ought to be: the fallback option when the search produces no results.
Margin compression occurs when there is a narrowing gap between what a lender earns on loans and what it pays for funds and losses. In auto lending, it first shows up in the product spread, while the balance-sheet net interest margin (NIM) may remain unchanged for several quarters.
For most businesses across industries, when rising costs, overhead, or supply chain disruptions hit production costs, profit margins tighten. In financial services, similar factors like inflation, rising interest rates, and shifts in consumer demand reduce profitability and pressure the bottom line.
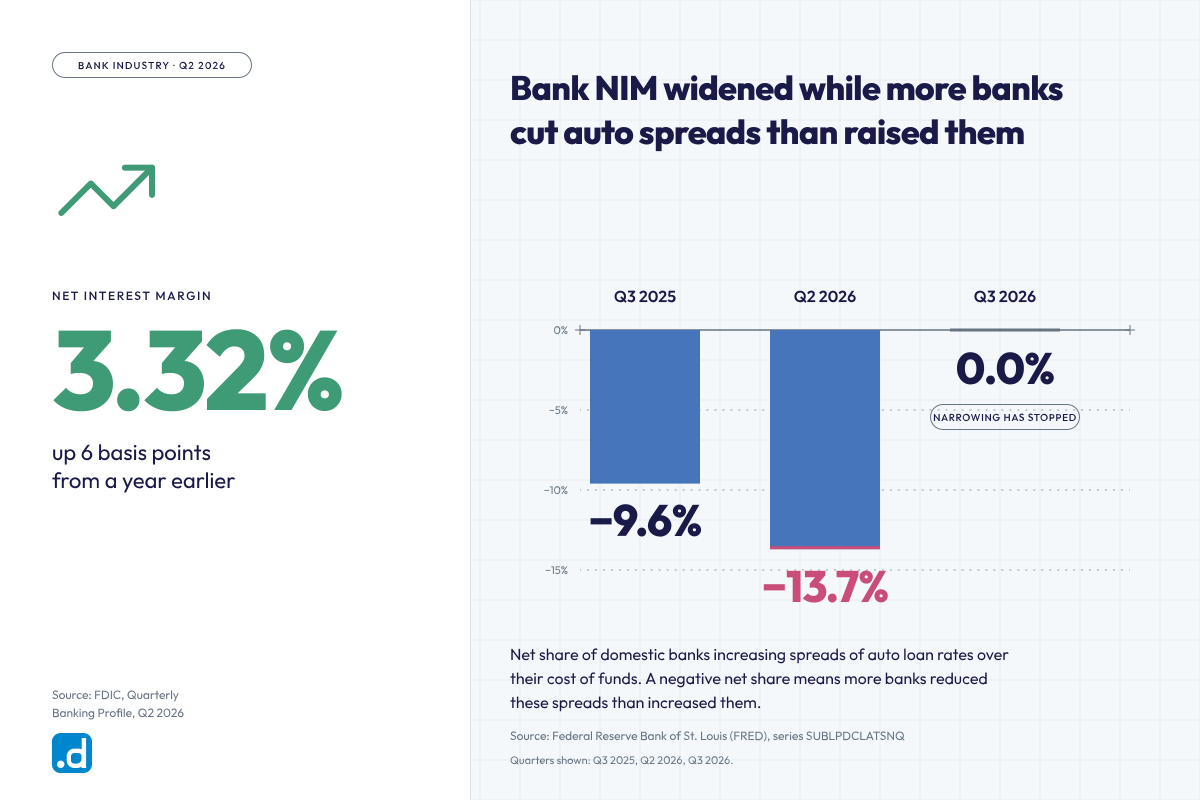
At this time, the two figures are pointing in opposite directions. Bank industry NIM was 3.32% in Q2 2026, up 6 basis points from a year earlier. Regarding credit unions, credit union NIM was 3.49% of average assets year-to-date through Q2 2026, up from 3.32% a year earlier.
Auto spreads went the other way. The net share of domestic banks increasing auto loan spreads over their cost of funds was −9.6% in Q3 2025, −13.7% in Q2 2026, and 0.0% in Q3 2026. A negative net share indicates that more banks reduced these spreads than increased them, accepting lower profit margins. The most recent figure of 0.0% shows that the narrowing has stopped but not reversed.
Interest rates decreased; in the second quarter of 2026, the commercial bank rate for 60-month new-car loans was 7.14%, down 53 basis points from 7.67% in the second quarter of 2025. Margin can be pulled in both directions because a bank’s balance sheet generates income from mortgages, credit cards, commercial loans, and securities, so a broader gross margin or net interest margin can offset a narrower auto loan spread for an extended period.
The auto line can also lag behind its own cause. In many ALCO packets, auto yield is reported net of the amortized dealer reserve, so a change in markup policy can appear as margin compression several months after the decision. By the time the line turns red, the contracts that caused the situation have already been on the books for two quarters.
Unpaid loans eat into net profits silently. Raw interest margins can look stable on paper, even as uncollected debt silently eats away at overall profitability. For lenders, however, lower margins can also be a purposeful strategy to attract customers or clients by offering lower interest rates to borrowers with high credit scores and stable payment histories. Whether margins are being eroded by uncollected debt or by deliberate marketing strategies, the high-level summaries credit committees often use for decision-making will not provide the depth needed to understand what is driving how much profit the business actually retains.
The auto rate sheet in the packet is a grid with score bands down the side, terms across the top, and a rate in each cell. When the committee alters a price, it’s changing an individual cell, and every borrower affected by that cell changes as well. Static tier pricing responds to compression by taking another average.
Two previously published figures indicate that the pressure is not evenly distributed. The New York Fed reports that the annualized flow of auto balances into serious delinquency was 3.00% in Q2 2026, up from 2.93% in Q2 2025. Over the same period, credit union auto loan delinquency stood at 0.81% in Q2 2026, down from 0.82% the previous year. While one series includes all auto balances and the other focuses only on credit unions, neither on its own answers the question; together, they suggest stress is increasing in certain areas while overall system rates remain almost unchanged.
That points to a working assumption. As long as the data does not indicate otherwise, a lender should treat auto margin compression as concentrated in a small number of populations and consider a move affecting the entire tier only as a last resort. Treasury will argue that a tier-wide move is quick and easy to explain. Both points are correct, but neither tells the committee where the increase will land.
An incorrect answer has consequences in both directions: underpriced populations remain underpriced because the rise is sized for the tier, and they need higher prices to offset rising costs, while overpriced ones get one additional reason to leave, their look-to-book keeps declining, and the loss report stays quiet.

Which borrowers is the auto book losing money on, and which is it charging too much? A tier report can’t say, because it only gives the average. The dotData Signal Intelligence Platform answers this by drawing on the application, bureau, and performance tables it has ingested: dotData Core reads every table in the lake, examines the relational combinations among them, and ranks the Signals associated with each Registered Metric. Each Signal is returned as a Glass Box rule, consisting of the condition, the volume of the population that matches it, and the directional lift relative to a named baseline.
The work is divided between two app modules by direction. Portfolio Pulse, anchored to 90 days past due, identifies cases where the score is incorrect on the underpriced side, while Missed Opportunities, anchored to look-to-book, surfaces yield signals, not just risk signals, which is where the overpriced side appears.
Every Signal exports as production SQL, along with the underlying mathematical logic, so a validation team can recompute it independently from the source data without running dotData software. This SQL is incorporated into the current post-model adjustments, knock-out rules, and scorecard updates. No need to rebuild the loan origination system or introduce inefficient processes. dotData does not set rates, grant credit approvals, deny applications, or replace a decisioning engine. Instead, it ranks the key drivers behind the lender’s own Registered Metrics and outputs rules that existing systems can carry out; the pricing engine and the credit committee set the price.
There is one case the platform cannot handle. If the margin compression is driven by the funding side—that is, if deposit costs are repricing faster than loans—then the segment adjustment will not be able to recover it, and a tier-wide or funding response should be taken to protect working capital and cash flow. Therefore, the committee’s first question should be which side of the spread has moved.
Illustrative example (all figures are hypothetical): A medium-sized lender originates $418 million in auto loans annually. The lender’s auto spread has decreased by 38 basis points year over year, and the committee receives two memos during the same week. The figures below represent first-year interest on annual originations, so both memos use the same figure.
Treasury is proposing a 35-basis-point increase on all new auto originations. At $418 million multiplied by 0.35%, the yearly increase comes to $1,463,000 if the volume remains the same. It’s that simple, and it generates the most interest in the first year.
However, this broad increase does not align with the risk profiles of different borrower groups:
The credit analytics team ran a discovery on 90-day past-due accounts and look-to-book findings across two distinct segments, proposing targeted adjustments:
Net bottom-line impact: The Segment 2 rate cut costs $319,500 (−0.45% on $71M), while Segment 1 rate hikes yield $521,000 in additional revenue, resulting in a net first-year gain of $201,500 while protecting long-term portfolio growth.
Any rule change affecting borrower groups must undergo a Fair Lending/ECOA review before implementation to ensure the risk criteria do not unintentionally discriminate against protected classes. Rule signals make this easier because they are readily auditable, so compliance can understand the exact impact upfront.
The margin that ALCO considers is the average of margins that no one has priced individually. When this margin narrows, a fix that applies across the entire tier treats the average as if it were the problem, even though the loss lies within the populations it encompasses, and a small number of those populations bear the majority of it.
Discovering the responsible segments means running a discovery process. Without discovery, lenders risk a double cost: first, overpriced borrowers will leave for competitive alternatives or new firms offering better rates; second, underpriced borrowers are likely to stay at a rate that still doesn’t adequately cover their risk. The two memos put it in numbers: $521,000 aimed at a $676,000 problem, instead of $1,463,000 charged mostly to borrowers who weren’t causing it.
To increase margins and maintain a competitive edge, business-leading executives must focus on operational efficiency, keep pace with industry trends, and make informed decisions that protect the value of their portfolio.
Margin compression is the narrowing of the spread between what a bank earns on its assets and what it pays for its funding, typically measured by the net interest margin (NIM). In lending, pressure can first hit one product before it affects the entire balance sheet. Bank industry NIM was 3.32% in Q2 2026, up 6 basis points from a year earlier, even as bank auto spreads narrowed.
Three factors are responsible: funding costs are increasing faster than asset yields, asset yields are declining faster than funding costs, and credit losses are eating into what’s left. Auto yields are falling now. The commercial bank rate for 60-month new-car loans was 7.14% in Q2 2026, down from 7.67% in Q2 2025. The speed at which deposit costs fall determines whether or not this puts pressure on a lender.
They reprice where the error is and keep the funding response separate from the pricing response. An increase that applies to the entire tier charges all borrowers for the losses of just a few. Since tier rates are directly based on the score, repricing pays off where the score misreads the population.
No. A lender can intentionally narrow spreads for well-performing borrowers to protect volume, which is often the right solution for the overpriced side of a tier. Missed Opportunities, anchored to look-to-book, is built to find those borrowers.
Net interest margin is interest income minus interest expense, relative to earning assets. Risk-adjusted margin also subtracts expected credit losses, so it narrows when losses rise, even if the spread remains unchanged. On auto loans, the annualized flow of auto balances into serious delinquency was 3.00% in Q2 2026, up from 2.93% in Q2 2025.
See which side of your spread moved. dotData ranks the populations behind an auto book’s compression and returns them as SQL rules your validation team can recompute. Contact the dotData lending team to protect your profitability and stay ahead in increased competition.