
Cracking Multidimensional Time Series Forecasting with Automation
- Technical Posts
Kaggle, the world’s largest data science community, and the University of Nicosia conducted a global competition to forecast the sales of thousands of products sold by Walmart, the world’s largest retailer. The competition involved over 5500 teams from all over the world, during a period of 4 months. The objective was to forecast daily unit sales for over 3000 unique products across 10 Walmart locations in 3 US states. The available data included item-level, department, product categories, calendar, selling price, and store details.
The dotData team leveraged our Enterprise AI Automation platform for M5 data analysis and delivered outstanding results – ranking in the top 1.8% (#102 out of 5,500+ teams). The process required less than one hour of manual effort from a single person and almost zero data preprocessing. The purpose of this blog is to demonstrate how citizen data scientists such as business analysts and BI teams can leverage our Automated Feature Engineering to quickly deliver results against world-class data scientists with minimal effort.
Time-series forecasting, such as demand forecasting, revenue forecasting, and sales forecasting, is one of the most fundamental and common requirements in many businesses. While many forecasting techniques exist (for example, classically, auto-regressive models or state-space models, and more recently, Long Short Term Memory Neural Networks), real-world time-series forecasting problems have never been easy.
The task of this competition is to forecast SKU-level product demand, critical for retailers to optimize the inventory level. Some of the challenges faced when working with this data are:
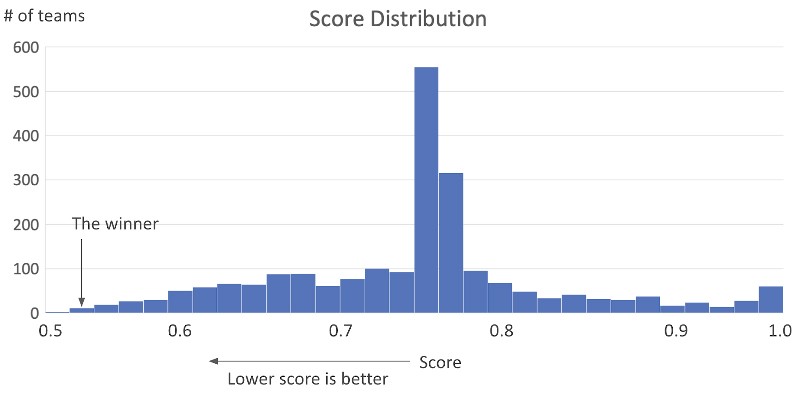
The competition continued for 4 months and participants tuned their models by applying different preprocessing methods and modeling algorithms. Figure 1 shows the score distribution of the top 40% of participants (the scores were less than 1.0):
The first execution using dotData involved building models for each store, which resulted in 10 models. Here are the steps we took:
0Step |
Preprocessing outside dotData platform |
1Step |
Configure learning task on GUI |
2Step |
Run learning task for each store |
3Step |
Run a prediction to calculate the test score |
Phenomenal result given the complexity of the problem and using end-to-end automation with no input from a domain expert |
|
The only preprocessing we performed was to add a column with year, month and week number information to the Sales Transaction data using the DATE column. This was done to be able to join this transaction data to the Selling Price data. (This can be easily done using YEAR, MONTH and WEEKNUM functions in MS Excel) |
|
|
|
TOP STATS:43Hours 10Models 3%(top 3% – 170 out of 5,500 teams)>3% |
|||||
Learn about dotData Feature Factory: an enterprise-grade feature discovery platform.
Using standard configuration, for each store, dotData automatically explored over 100,000 features and validated their statistical significance to create a feature table. Using those features dotData generated over 500 models with different combinations of hyperparameters for both linear and non-linear machine learning algorithms such as L1/L2-regularized regression, regression tree, LightGBM, XGBoost, PyTorch, TensorFlow, etc. dotData supports various advanced techniques to encode temporal information into temporal features and ML algorithms can further optimize the combinations of such temporal features to achieve the best forecasting accuracy.
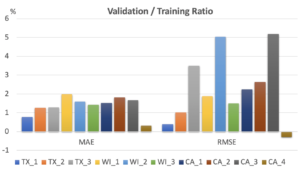
Not very surprisingly, 9 models (i.e. 9 stores) used XGBoost, and 1 model used LightGBM (so all models eventually selected gradient boosting algorithms) while different hyper-parameters and feature sets were applied. Figure 2 shows the ratio of training and validation scores for each model. As we can see, the validation MAE was only 1-2% worse than the training MAE. The validation/training ratio w.r.t. RMSE was larger (3-5%) for a few stores but this was because the absolute sales values were big. Overall, the models automatically developed by dotData were well generalized with little overfitting.
As you can imagine, most Kagglers should have used XGBoost, LightGBM or Neural Networks and we used the same ML algorithms. Then why dotData could achieve the top-3% score from the beginning? The answer lies in dotData’s ability to explore a massive amount of advanced temporal features.
Table 1 shows examples of temporal features that dotData automatically discovered. As you can see, there are different types of temporal features. It is interesting that we can map these features to our domain feature engineering process such as hierarchical patterns or periodical patterns. It is worth emphasizing that dotData explored over 100,000 features for each model. If doing manually, it would entail writing complex queries and hundreds of lines of code. Additionally, one needs to have a good grasp of the domain to generate relevant features. dotData avoids any need for writing code, queries and domain expertise by completely relying on signals in the raw data.
Table 1 Examples of temporal features generated in CA store models
| dotData temporal features | What is the feature about? |
|---|---|
| Sales in the last 14 days | Simple temporal aggregation |
| Sales of “household” items in the last 28 days | Hirearchical and temporal aggregation feature based on product category |
| Sales in the same week the previous year | Annual periodical pattern |
| Sales in the last 60 to 90 days and no occourrence of SNAP events | Temporal aggregation conditioned by a specific flag |
| Sales on Mondays in the last 90 days | Pattern by day of the week |
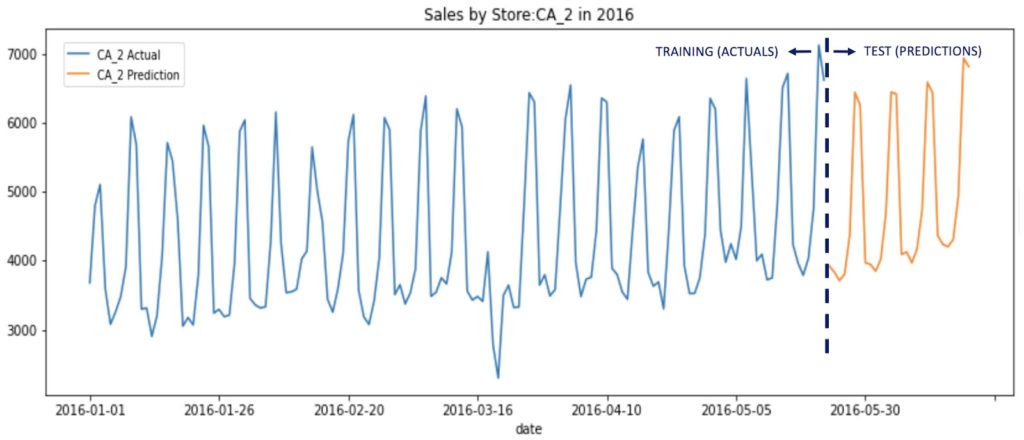
The competition submissions are evaluated on predictions for a 28 days period in 2016 (the data in the test period is not disclosed so it is blind testing). Figure 3 shows a time series plot of “actual” sales for one store (CA_2) in California in 2016 for the training period and “predictions” for the test period (the last 28 days). Since we do not have the “actuals” for the test period we can perform a qualitative evaluation of the trend. As shown in the plot, the trend in sales is captured pretty well in the predictions.
The Top-3% score was already amazing but we proceeded our trial one step further. Given the hierarchical nature of the data (i.e. state-level – store-level – product category level – item level), the problem can be looked at from different angles. Sometimes building models at a specific level in the hierarchy might perform better than the other levels.
Our second execution to build more robust predictions is to incorporate such “hierarchical information.” The step was very straightforward. We build models in different levels using the same steps as the first execution:
The final prediction was the simple average of predictions in all 4 levels.
Figure 4 shows a time series plot of “actual” sales for Foods and Household categories in one store (CA_2) in California in 2016 for the training period and “predictions” for the test period (the last 28 days).
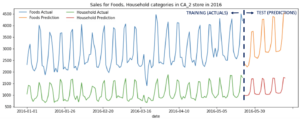
This simple-average ensemble significantly pushed up the ranking from #170 to #102 (top-1.8%). More importantly, the result was achieved with little manual pre/post-processing with reasonable computation time. We are very excited that our automation achieved very competitive results with world-class data science teams in a very practical enterprise use case.
For most retailers, forecasting requires an army of data scientists who toil for months constructing features, generating models and delivering predictions. However there is a better way to tackle multi-dimensional time series forecasting. By using dotData’s Machine Learning Platform with end-to-end automation, we delivered accurate predictions that were ranked in top 1.8% (#102 out of 5,500+ teams) using only 150 hours of computation time. Any BI analyst using few clicks, and without any coding, can deliver results just like a data scientist. dotData empowers citizen data scientists to achieve high accuracy with explainable features using powerful AI automation.