
Agentic AI in Data Analytics – Explore Amazon Q in Amazon QuickSight
- Technical Posts
Generative AI is bringing significant transformations across industries, especially in business intelligence. The concept of “Agentic AI” has gained attention, and we are seeing the emergence of platforms that leverage AI to autonomously execute tasks previously only feasible through the use of highly trained human experts. For example, agentic AI is making strides in automating areas like customer support, anomaly detection from financial data, and assisting in medical diagnoses. Many companies are focusing on this area, and we are seeing a rise in conversations around Agentic AI and early-stage related services.
The growth of Agentic AI is also prevalent in how businesses utilize data. With the evolution of generative and agentic AI, the tasks of data analytics, previously handled by data scientists and analysts with specialized training in computer science and analytics, can now be automated – to a great deal – reducing costs and accelerating time-to-value. Integrating BI (Business Intelligence) tools with agentic AI can make analytics more intuitive and significantly lowers the barriers to data analysis, finally fulfilling the promise of “self-serivice” analytics.
Amazon QuickSight’s agentic AI is revolutionizing interactive visualization and report creation, offering advanced capabilities compared to traditional BI platforms. QuickSight’s agentic capabilities have the potential to dramatically change how companies get value from data.
This blog post provides a quick review of Amazon Q in QuickSight, announced at AWS re:Invent in December 2024, and discusses agentic AI’s current state and future potential in data analytics.
Amazon QuickSight is an AWS cloud-native Business Intelligence tool that helps companies achieve decentralized embedded analytics inside any application with customized, interactive visuals and dashboards.
Amazon Q is an automated assistant powered by generative AI integrated within Amazon QuickSight. While Amazon QuickSight has been widely recognized as a BI tool, Amazon Q offers an entirely new experience with the addition of generative AI.
Amazon Q allows users to ask questions in natural language, helping them easily analyze data and create and publish interactive dashboards. Traditionally, BI tools required writing SQL queries or – at a minimum – having a deep knowledge of underlying data models. Amazon Q allows users to simply input data and give basic instructions to automatically perform tasks like trend analysis, anomaly detection, and basic factor analysis. Additionally, using AWS cloud technology, Amazon Q can process large datasets quickly and efficiently, optimizing the analysis environment.
An added benefit of the intuitive user interface (UI) of Amazon Q is that it is far more approachable for business users, reducing the complexity and in-depth data knowledge typically required by BI tools.
Users can input questions like “What is this month’s sales trend?” and Amazon Q automatically extracts relevant data and creates the appropriate charts.
The tool analyzes datasets, automatically identifying anomalies and trends.
Based on natural language instructions, users can easily create the visual reports they need. Amazon QuickSight also allows data sources to be embedded and BI dashboards integrated into external portals or internal systems.
Amazon Q in QuickSight plays a significant role in agentic AI for BI, understanding user intentions and automatically processing and visualizing data. This gives broader range of users the ability to engage with data analysis, once the domain of data analysts and BI engineers. Companies can leverage Amazon Q to accelerate data-driven decision-making and improve their competitive edge. The introduction of Amazon Q in QuickSight is a notable example of the convergence of BI and generative AI, which could significantly change the future of data analytics.
The next section will share our hands-on experience with Amazon Q in QuickSight.
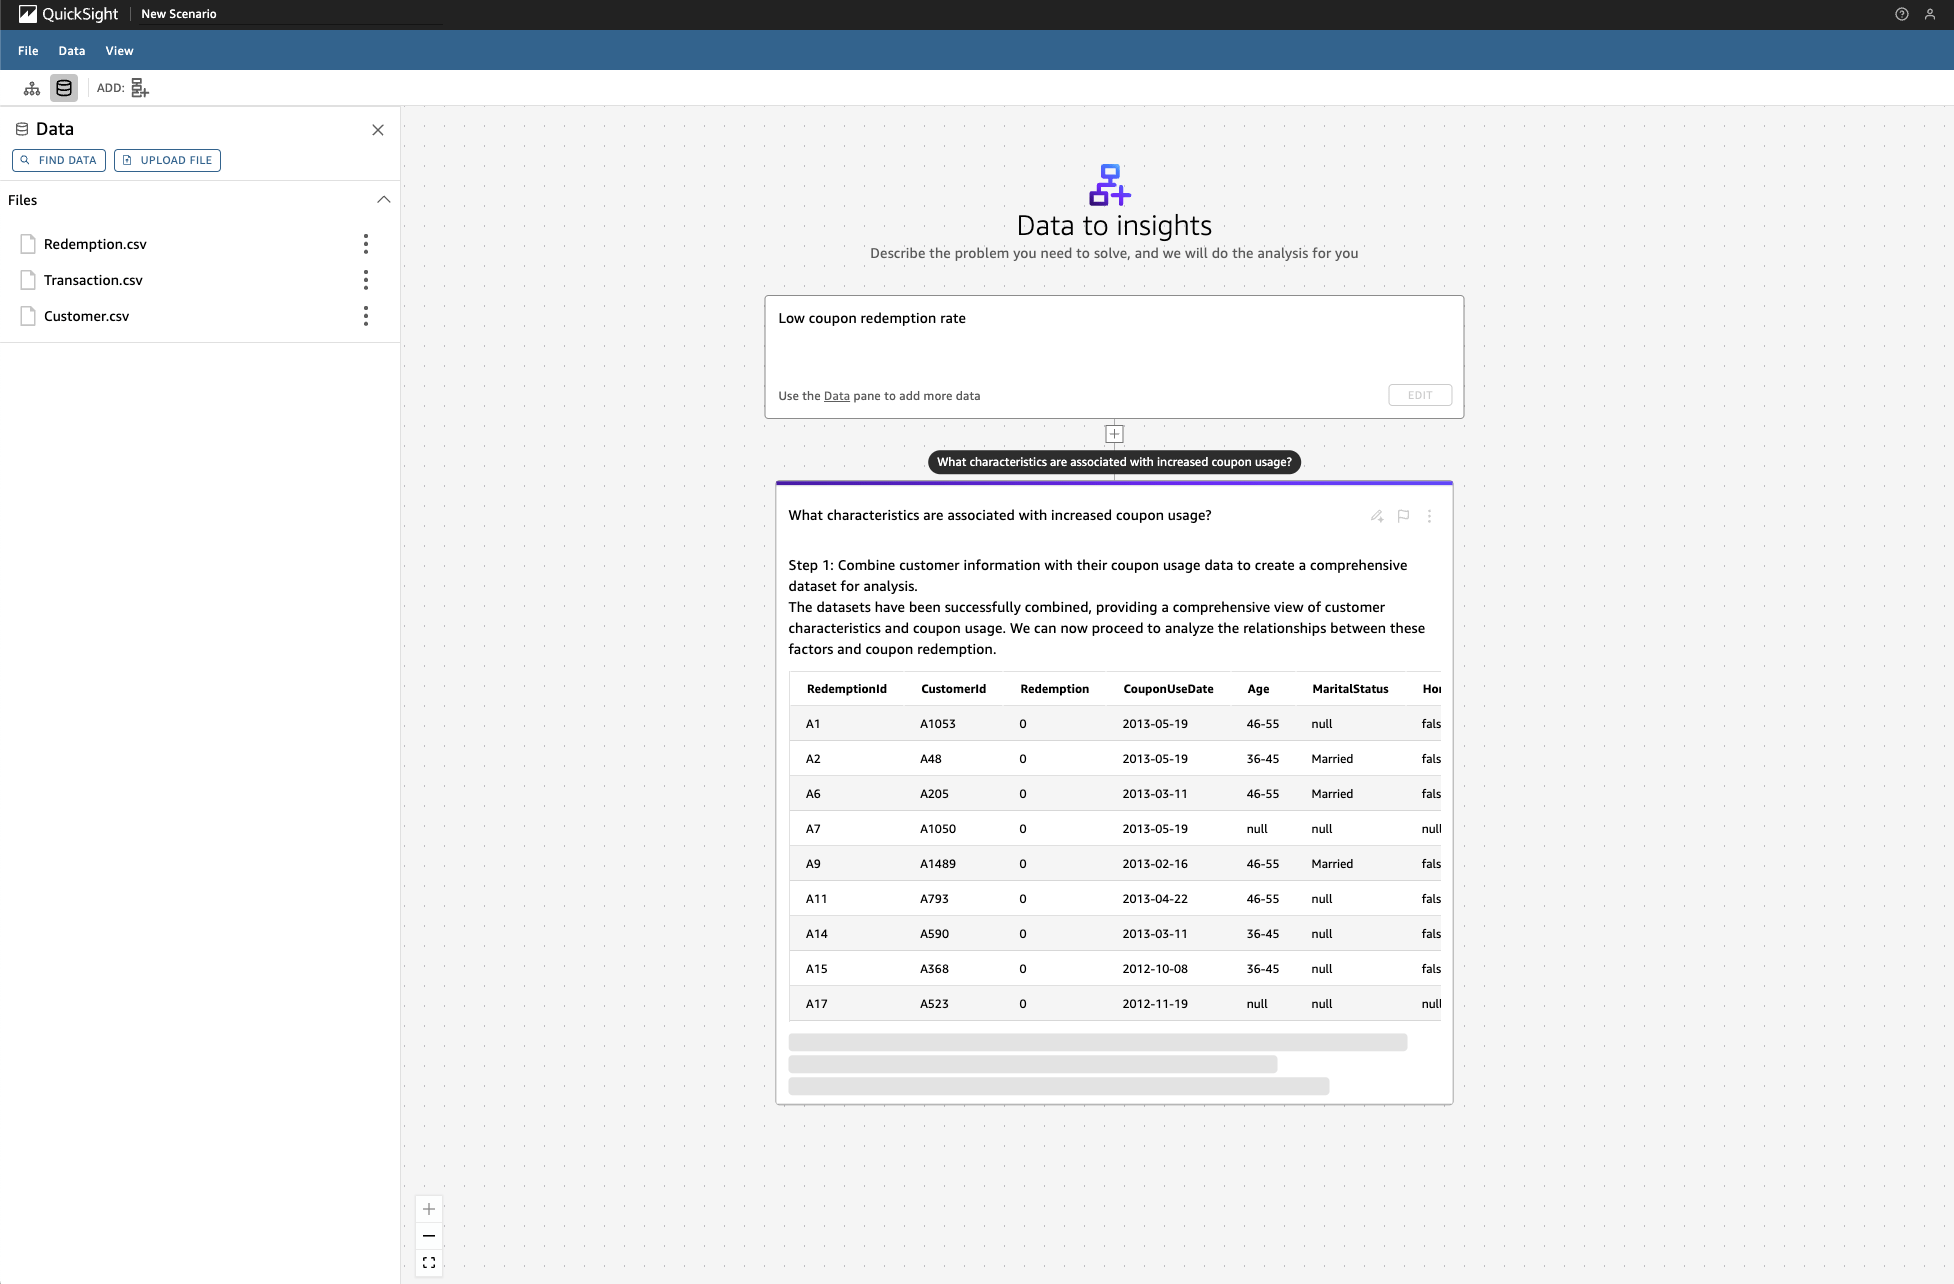
The basic functionality of Amazon Q in QuickSight involves specifying a dataset (table) and asking Amazon Q a question about the data. For instance, when analyzing coupon redemption rates with three CSV files (Redemption.csv, Transaction.csv, Customer.csv), if you instruct Amazon Q with “Low coupon redemption rate,” it will automatically perform an analysis of the reasons behind low coupon redemption, as shown in the screenshot below. The notable feature here is that Amazon Q autonomously reads, analyzes, and delivers insights with visualizations without the user needing to provide additional instructions. Users can have quick and easy access to business analysis for a faster and better decision-making process.
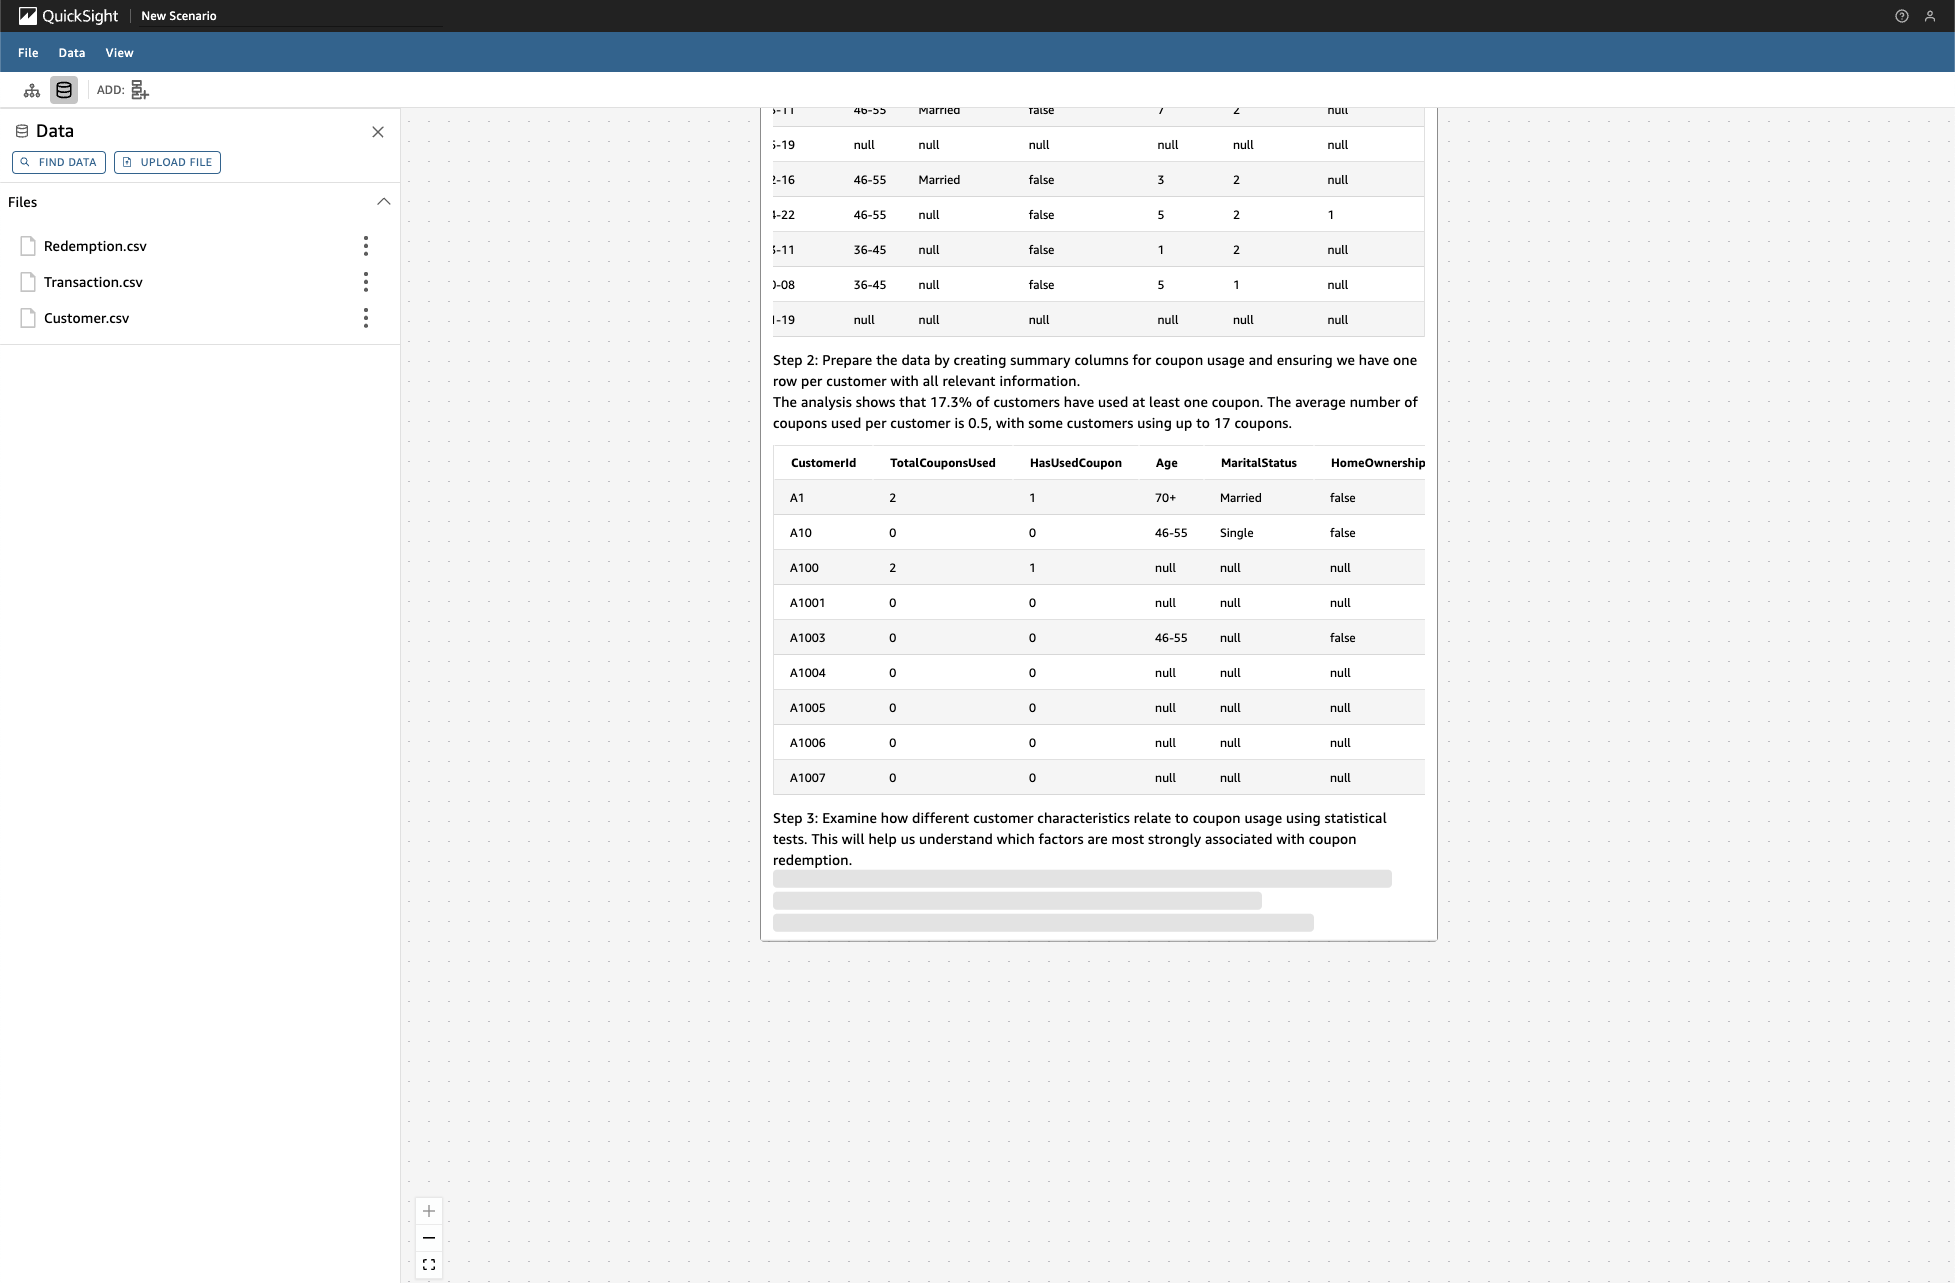
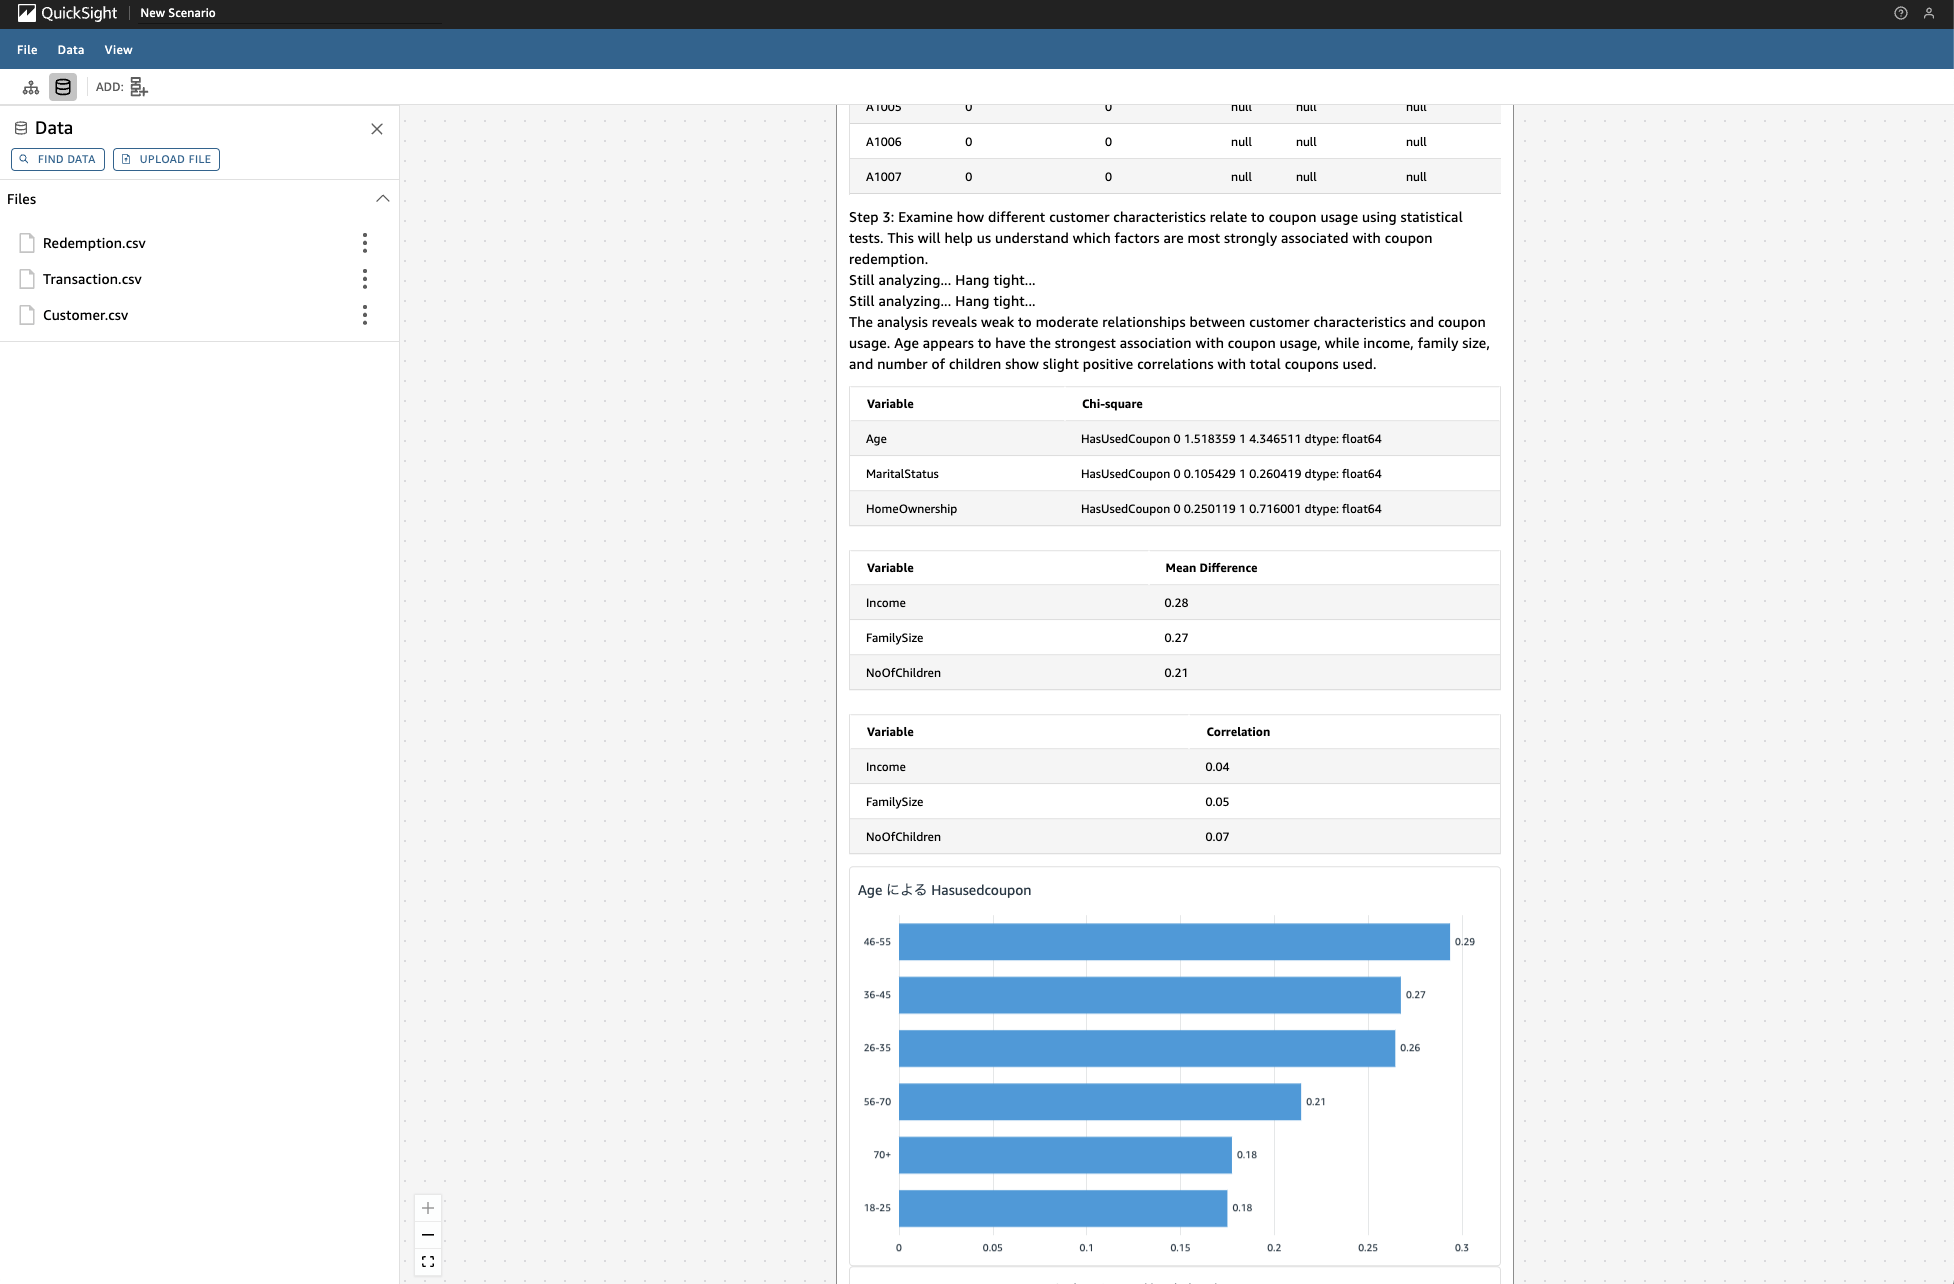
When necessary, Amazon Q can automatically perform simple table joins. In the following example, when asked about factors contributing to coupon redemption, Amazon Q automatically joins the “Customer.csv” and “Redemption.csv” files and analyzes them. Although the join is simply an ID match, it is interesting that Amazon Q automatically determines which tables to combine. Leveraging AWS cloud infrastructure, large-scale analysis is performed efficiently, enabling companies to make faster decisions.

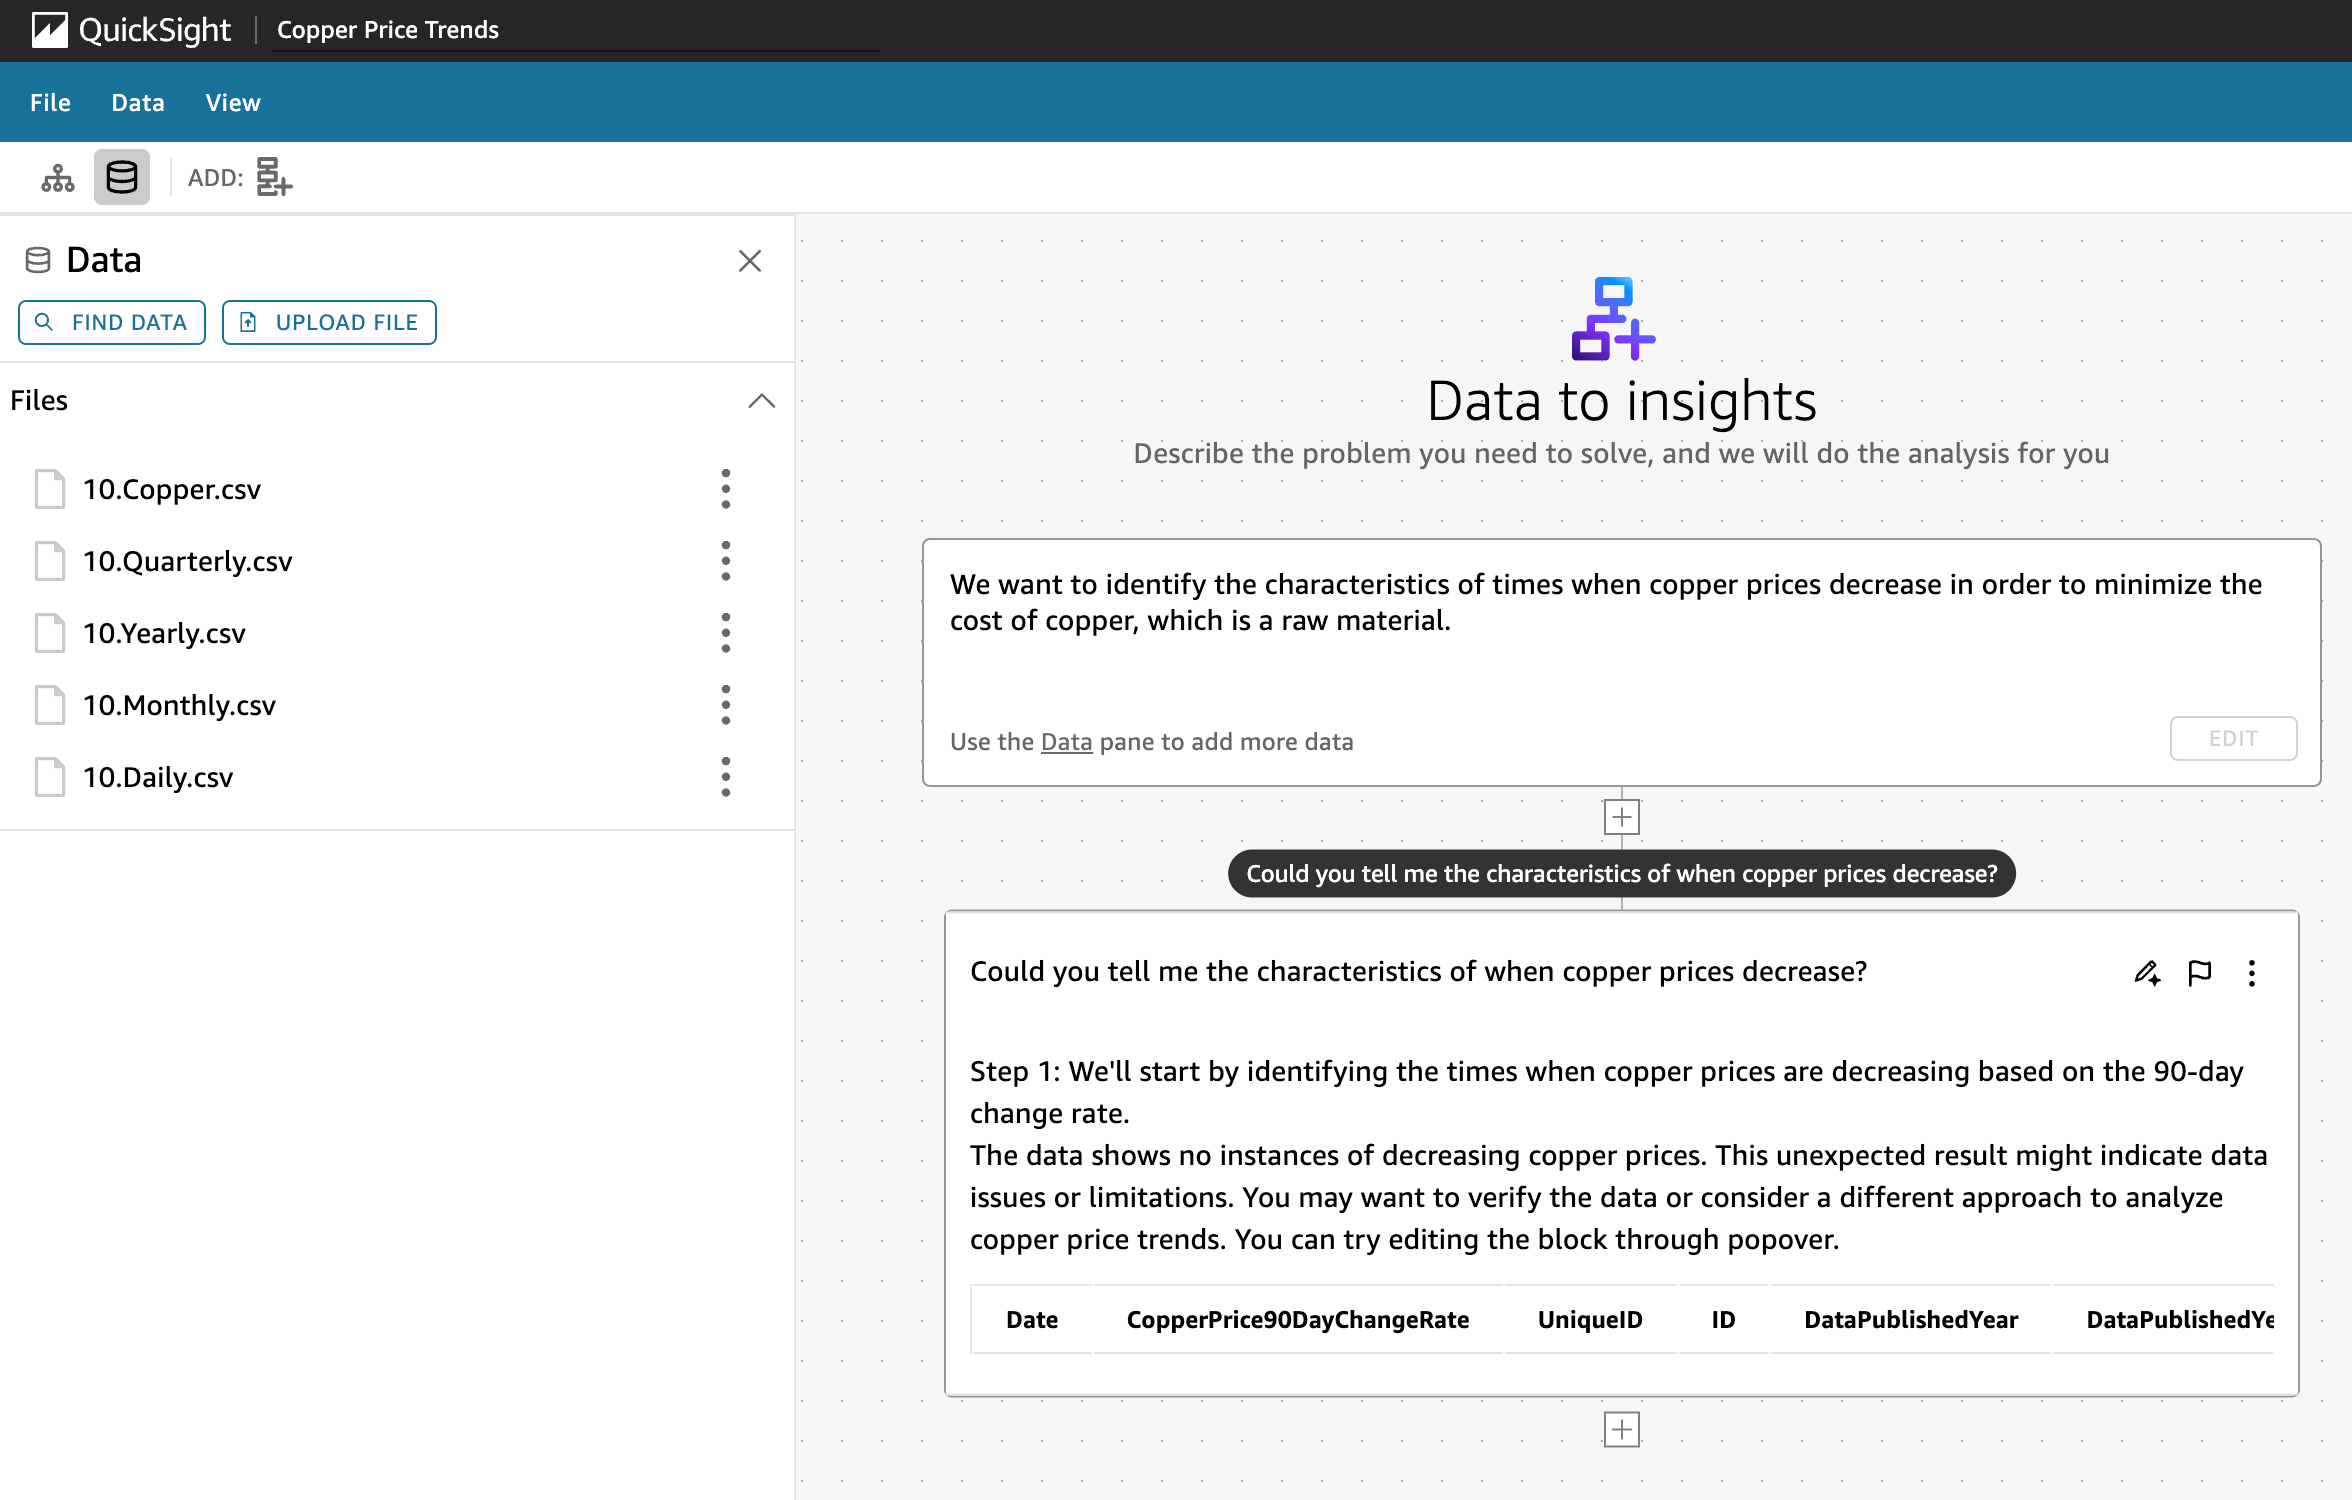
However, some analyses may still require validation, as Amazon Q sometimes presents incorrect interpretations. For example, an analysis of copper price fluctuations may incorrectly respond with, “The data shows no instances of decreasing copper prices,” even though Copper.csv contains copper price fluctuation data that could explain price decreases.
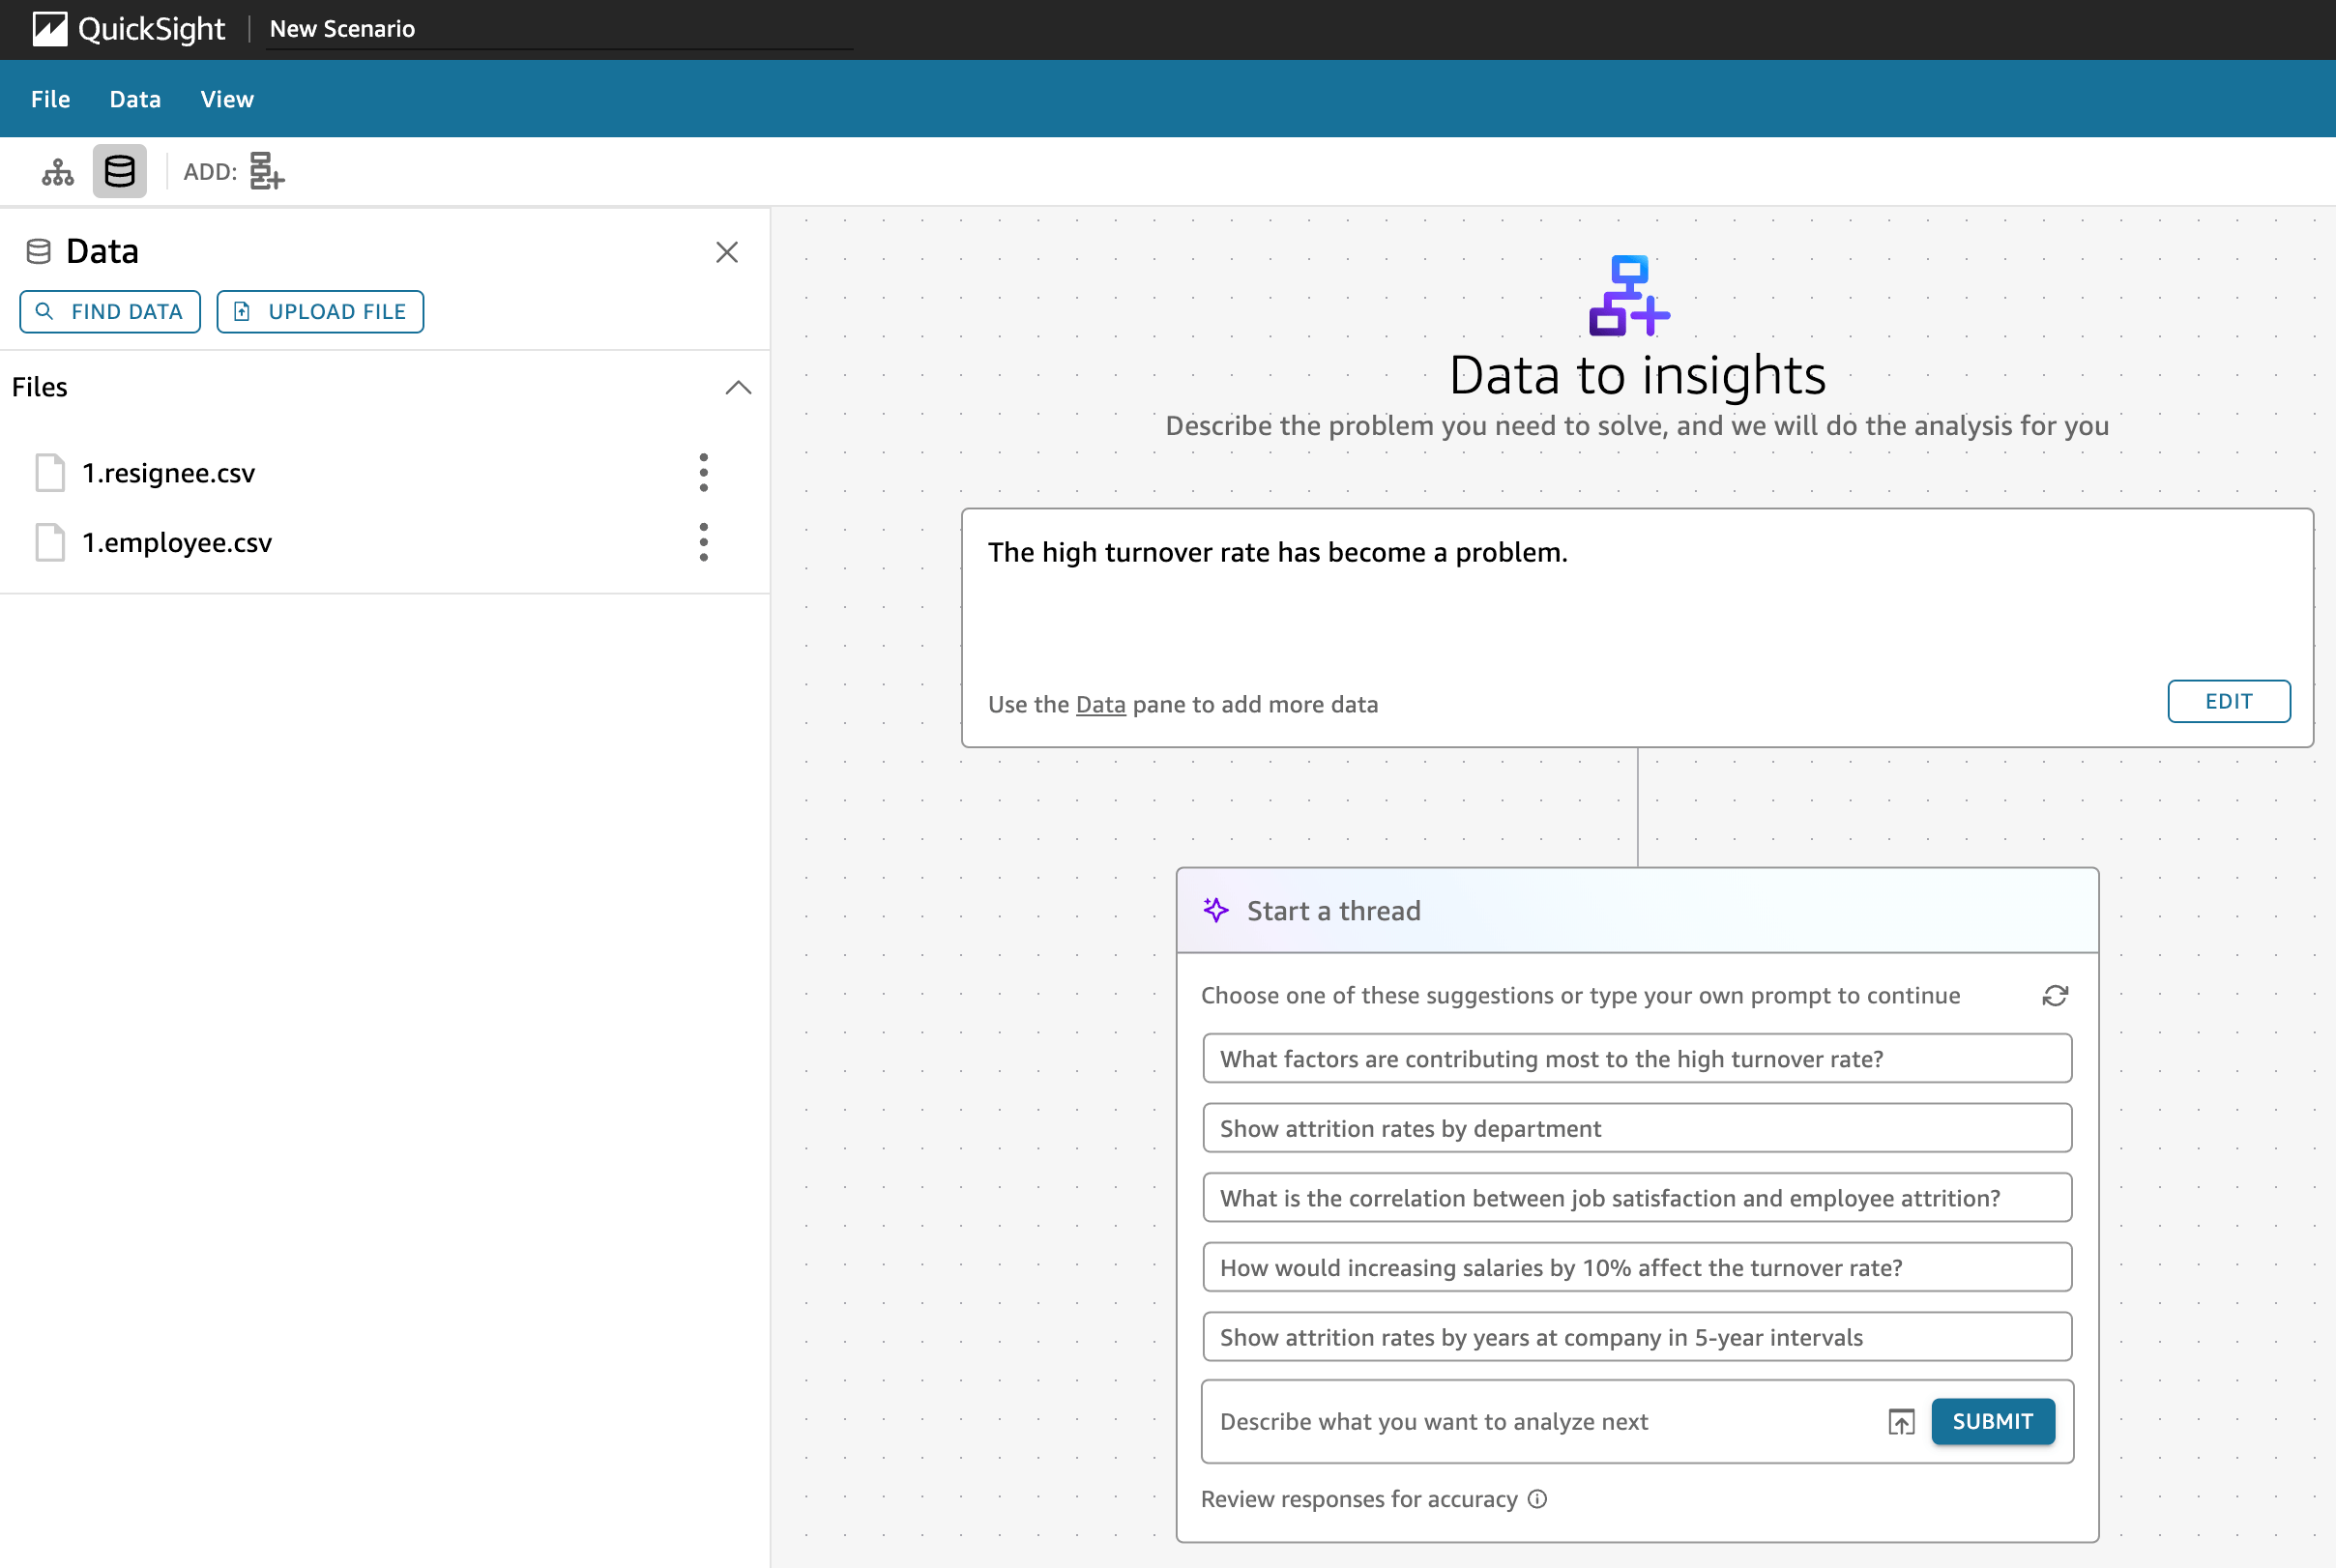
In another case, when analyzing factors leading to employee turnover by inputting basic employee information (age, tenure, job type) along with turnover data, Amazon Q responded with the following warning: “We need additional information to fully address your request,” and failed to perform the analysis. This highlights that while Amazon Q is a powerful tool, it still faces limitations regarding analysis accuracy and reliability, especially for business users unfamiliar with data analysis.

Overall, Amazon Q in QuickSight is still in its early stages and occasionally struggles with accuracy and data processing, particularly with complex data joins and cleansing. However, its potential to revolutionize how agentic AI is applied in data analytics remains promising.
To understand some of the limitations of Amazon Q – and how it can fit in the larger analytics ecosystem, let’s break down the workflow for scenarios like analyzing coupon redemption, copper price decline analysis, or employee turnover insight. In all instances, the following steps are required to complete the analysis:
Amazon Q in QuickSight is designed to support step 6, along with some basic data processing after the data is prepared, providing simplified analysis and visualization.
dotData Insight is a data analytics platform for the generative AI era, offering comprehensive support from use case analysis to data cleansing, signals discovery, and the proposal of business strategies. While Amazon Q uses already clean data for simple analysis, dotData Insight enables more advanced data processing, including cleansing and automatic signal generation. This leverages AI to support the entire analysis process.
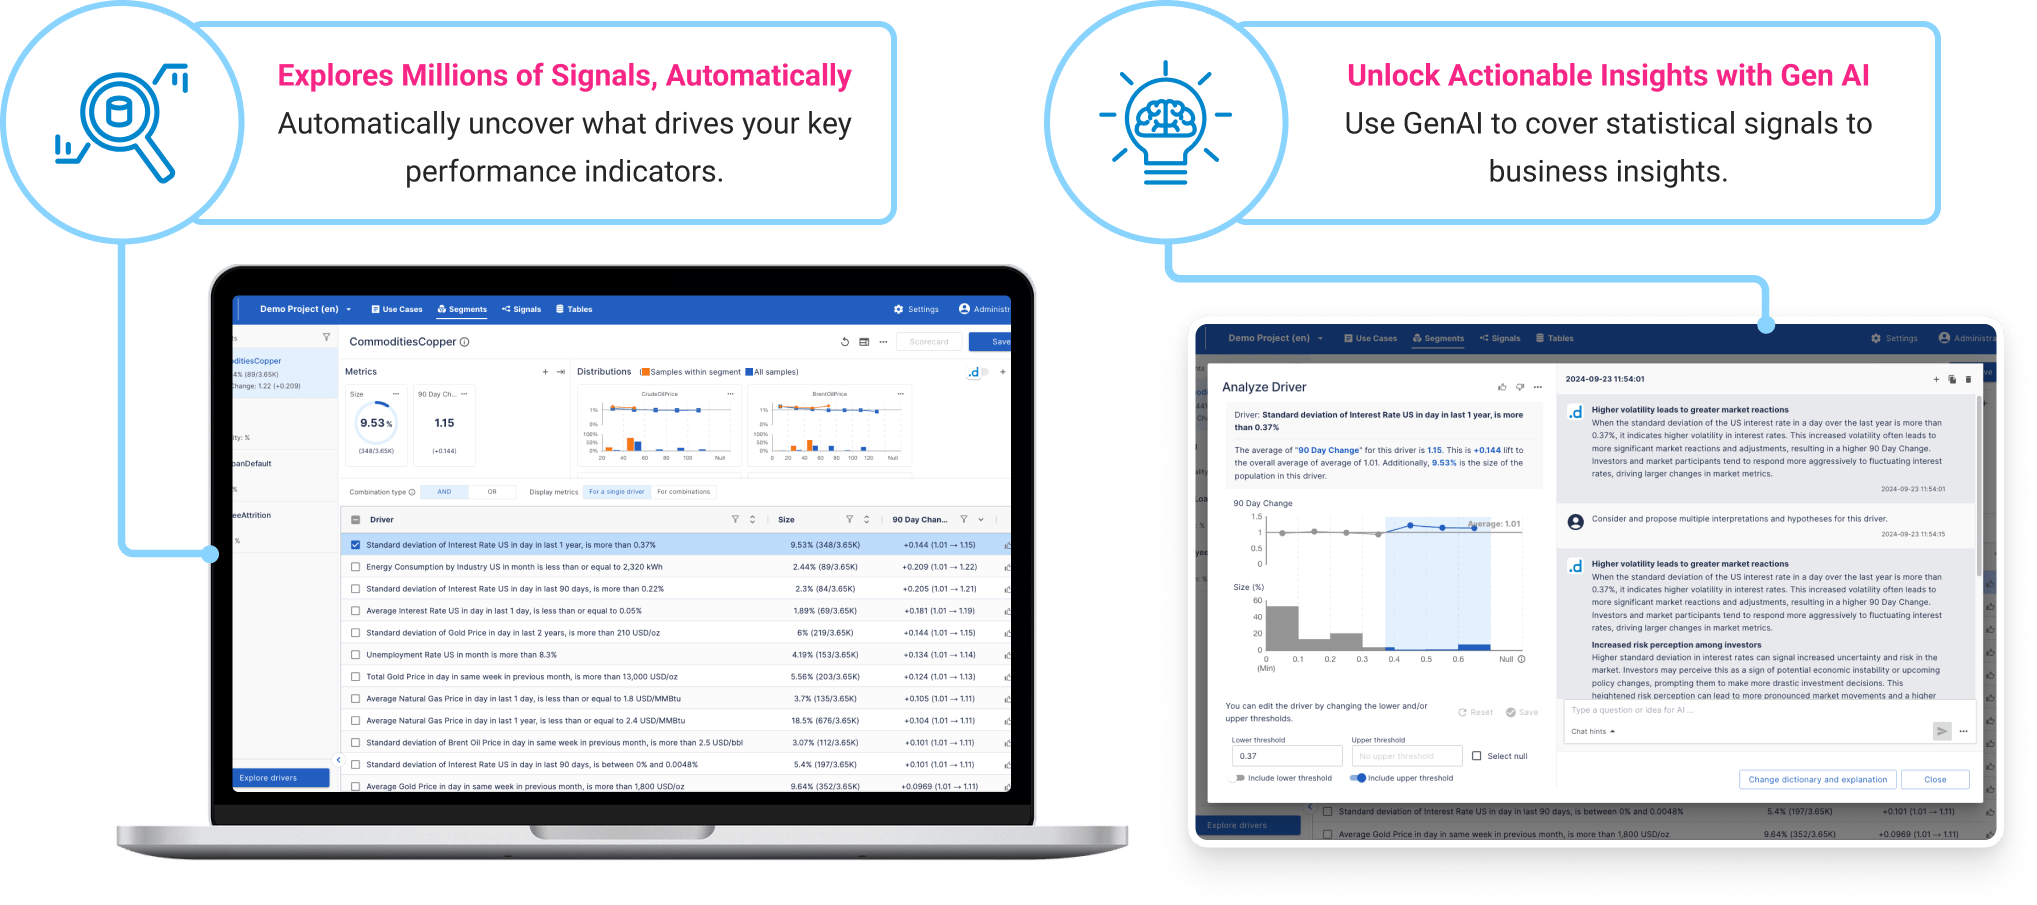
dotData Insight aims to evolve as an agentic AI for data analytics by integrating these powerful AI features, making the data analysis process more efficient and insightful. For case studies where dotData Insight clients leverage AI automation technology, check our resources here.