
Auto Loan Charge-Off Rates: Discovering the Hidden Signals Before Losses Hit Your P&L
- Industry Use Cases
 dotData
dotData
dotData
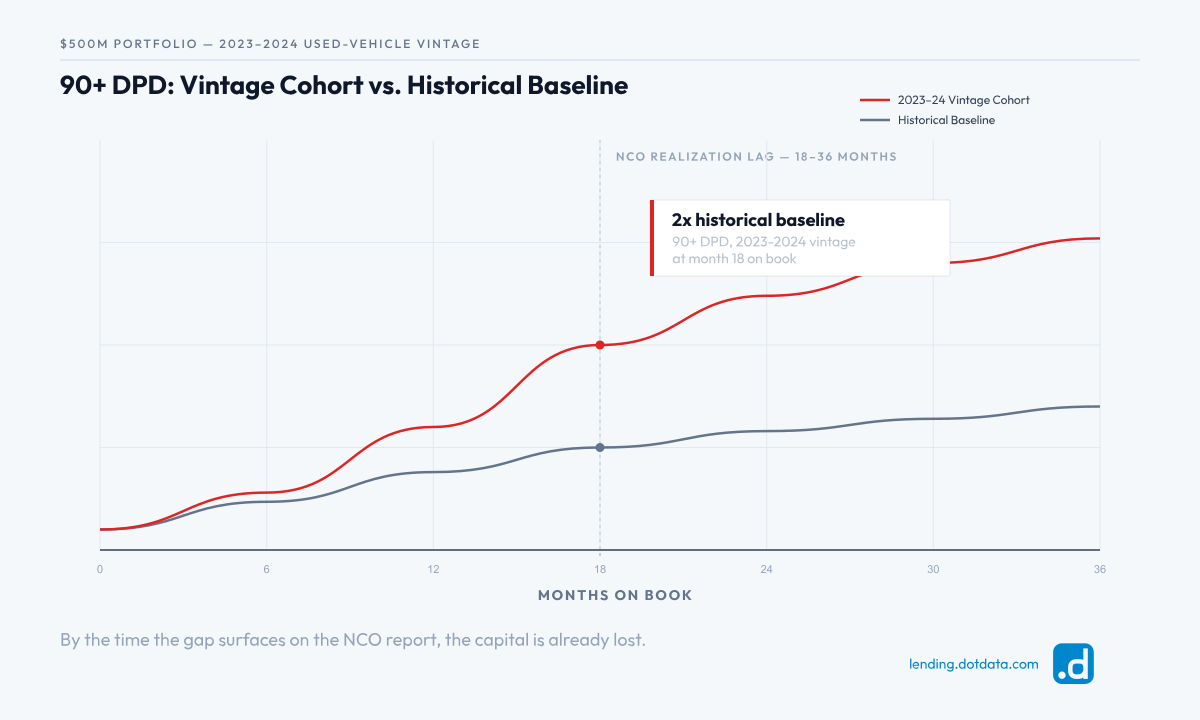
A Chief Risk Officer overseeing the auto loan charge off rate strategy across a $500 million auto loans portfolio may look at the organization’s performance data and see — at first glance — signs of stability. Diving deeper, however, that CRO would see underlying changes in progress. The 2023 and 2024 vintages, a particular segment of used-cars financing, are trending towards 90 days past due at double the company baseline history. By the time these charged off accounts appear on the final report, the money and capital are already lost. In this context, missing behavioral signals skews delinquency categories and directly impacts profitability by millions of dollars, as unrecovered principal is lost before your team can even begin implementing post-model adjustments.
The scenario above may be hypothetical, but it mirrors the challenges many commercial banks and non-bank lenders are facing across the nation. In fact, the Federal Reserve reported that consumer loan charge off trends contributed to an overall charge-off metric hitting 2.87% among all banks in Q4 2025. Credit unions are also under pressure as the NCUA reported that total gross car loans net charge offs reached $5.6 billion in 2025, a significant year-over-year rise that pushed the net charge off ratio to 78 basis points by the end of the year.
The net charge off rate is the P&L’s final verdict on underwriting decisions made 18 to 36 months earlier. By the time it moves, the capital has already left the building. Standard scorecard models are calculated using average loans behavior — they produce aggregate NCO forecasts while systematically missing the specific sub-segments where trouble is concentrating fastest.
The CRO cannot solve the problem by simply expanding score bands. While overall outcomes seem manageable, troubling, usually undetected pockets of risk remain.
A FICO score, a stated income, and a debt-to-income ratio. None of those variables, evaluated at a single point in time, tell you which specific borrower account combinations are two quarters from going through the charge off process.
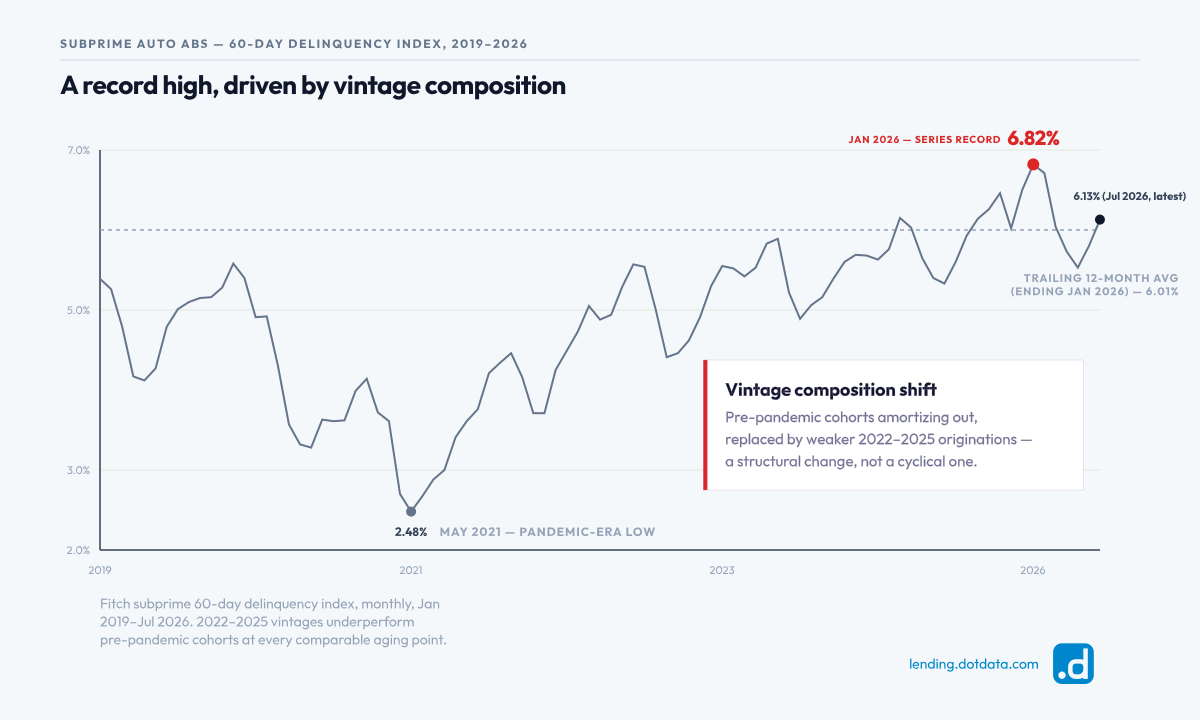
Origination vintages from 2022 to 2025 are performing worse than their pre-pandemic counterparts at all comparable aging points. The subpar performance is not the result of poor underwriting but of a combination of macroeconomic factors that made the loans seem safe at origination but reversed after funding. Changes in vehicle values and an increasingly unstable labor market mean that a scorecard that relies only on historical average loans cannot flag the specific account-level combinations susceptible to the pressures we are seeing. Research from the Federal Reserve corroborates that recent auto loan vintages continue to exhibit higher delinquency rates than pre-pandemic cohorts at equivalent months on book.
The clearest market signal is that Fitch’s 60-day subprime auto ABS delinquency index reached a record high of 6.82% in January 2026, up from 6.15% the year before, while the trailing 12-month average rose to 6.01%. Fitch attributes this trend to two main factors: deteriorating collateral and shifts in vintage composition — stronger cohorts from before the pandemic are amortizing out, replaced by weaker originations from the post-pandemic period. This is a structural change, not a cyclical one. Aggregate scorecard models are built to smooth over gradual compositional shifts like this, which is exactly why the trend keeps surfacing unexpectedly in the NCO line.
The Signal Intelligence Platform runs a different kind of analysis entirely. Instead of waiting for a human team to hypothesize which variables matter, it evaluates millions of cross-table relational combinations automatically — joining LOS application data, LMS payment history, and bureau tradeline records — to surface the Driver Signals that explain why a specific vintage cohort is deteriorating faster than the model predicts. Analysts still control what gets deployed. They stop spending time manually testing obvious variables and miss the non-obvious compounding interactions buried three tables deep.
During Q4 of 2025, nearly 30% of new vehicle trade-ins had negative equity, the highest share since Q1 2021, according to the Philadelphia Fed. When a borrower defaults on a loan, the lender must absorb the difference between the outstanding balance and the vehicle auction value. The shortfalls caused by negative equity are structural and compress Loss Given Default in ways headline delinquency rates do not show until charge-offs are removed from the books.
The LTV problem intensifies in two ways. TransUnion reported that used car loans with LTV ratios over 120% rose from 38% in Q2 2022 to 53% in Q2 2025. When cars depreciate faster than balances are paid down, lenders face a growing equity gap. As consumers opt for longer-term financing, lenders face the reality that when accounts default, average recoveries, which in Q3 2025 was merely 30.58%, means that lenders are facing a net loss of 70 cents on the dollar of all outstanding balances that are not collected.
Most loss forecasting models treat LTV as a single origination-point variable. They do not model how LTV interacts with payment method behavior, collateral depreciation curves by make and trim, and tradeline deterioration velocity over the loan’s life. The Signal Intelligence Platform does not, and the difference between the two approaches is reflected directly in the NCO line.
Lenders can use the Signal Intelligence Platform to combine data from multiple sources to identify Precision Impact Segments, where signals such as LTV exposure, payment methods, dealer scorecards and tradeline behaviors can be combined to detect early indicators of default probability and potential recovery shortfalls before the loan is even funded, not after a charge-off. Lenders can stop treating LTV as a single metric of success or failure and instead view it within the larger perspective of loan signals.

The NCUA’s 2025 Supervisory Priorities letter has clarified the examiner’s role: NCO rates for used-vehicle loans have reached record highs, prompting examiners to ask whether commercial banks and credit union risk models can detect deterioration before losses occur. Most models fall short — not because they lack data, but because the patterns indicating default risk rarely exist within a single data table. They arise from interactions among changes in LMS payment velocity, shifts in tradeline composition, and the trajectories of LTV-to-collateral depreciation, which may seem acceptable in isolation but together create a 90 DPD default rate significantly higher than the portfolio baseline.
For instance, while a lender’s overall loan portfolio looks perfectly safe and profitable, a specific, hidden segment of risk—likely subprime or higher-risk used-car loans—is failing at a rate three times higher than the rest of the business. Because this high-risk segment is buried in aggregate data, traditional forecasting models fail to capture it without multi-source, multi-table analysis and the ability to pinpoint Precision Impact Segments.
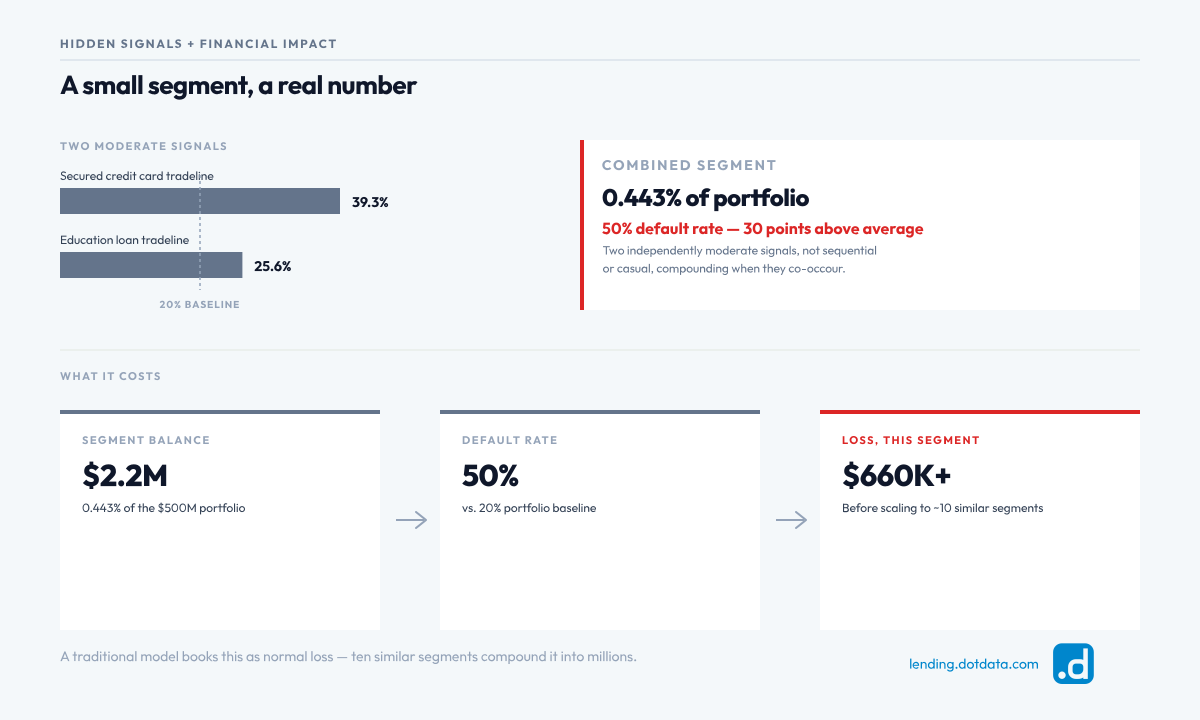
In dotData’s Signal Intelligence Platform, a Driver Signal might identify accounts with an active secure credit card on their tradelines over the previous two years as having an elevated 90DPD risk of 39.3% vs. a 20% portfolio average. A second Driver showing an active education loan during the same two-year window might lift the DPD risk to 25.6% on its own. Combining (or “stacking”) the two signals might represent only 0.443% of the portfolio, but might also carry a 50% default rate, a 30% jump above the average. This type of segment is not a hypothesis but the automated computation of a multi-source, multi-table interaction that manual analysis could never have detected.
From a P&L perspective, the $500 million used-vehicle portfolio we discussed earlier, which might have a Precision Impact Segment of 0.443% of total volume, would result in an outstanding balance of $2.2 million. Assuming a 50% default rate against a 20% baseline, the segment’s additional charge-offs would be around $660,000. A traditional model would treat these write-offs as a normal loss. Still, if we can identify ten other similar segments across the entire portfolio, the combined loss would be in the tens of millions. With dotData’s Signal Intelligence Platform, we can.
Most risk teams implement a Post Model Adjustment (PMA) workflow. The critical question is what feeds these adjustments. If the only inputs are manually generated hypotheses and quarterly basis scorecard recalibrations, the operational cost of waiting is measured in realized losses. Discovered Driver Signals can be converted directly into PMAs with clean, interpretable SQL code that integrates easily into Loan Origination Systems without IT project overhauls or core LOS modifications.
The operational latency problem is not a data problem. Most lenders already hold the multi-table data that contains these signals — in the LOS, the LMS, and the credit bureau feeds. It is an analysis architecture problem. Manual analyst teams test a few dozen hypotheses per quarter; by leveraging AI in lending, the Signal Intelligence Platform evaluates millions of relational combinations in hours, then outputs production-ready SQL. Your credit committee gets a Glass Box rule with documented predictive lift rather than a black-box model recommendation that examiners cannot trace — and that examiner accountability gap is exactly what the NCUA’s current supervisory posture is targeting.
The automated pipeline engine in the Signal Intelligence Platform tracks all preprocessing and signal detection and selection decisions, runs identical workflows on incoming raw data in minutes, and can automatically generate clear, transparent SQL code. For the VP of Lending or CRO, the generated SQL becomes a simple checkbox rule. Signal discovery to post-model adjustment compresses from months to just a few days, allowing teams to contact at-risk borrowers early, restructure payments, or take pre-emptive measures to avoid repossession altogether.

The Federal Reserve’s consumer loan charge-off rate across all commercial banks was 2.87% in Q4 2025 (not seasonally adjusted). For federally insured credit unions, the NCUA reported a system-wide net charge-off ratio of 80 basis points in Q4 2025. “Normal” varies materially by lender tier, credit mix, and vintage composition — the more relevant benchmark is whether NCO rate by segment is moving faster than the portfolio average, and whether the current model explains why.
Charge-off rates grow when the likelihood of default and Loss Given Default increase faster than the portfolio’s ability to recover through repossessions and net interest income. The current cycle is heavily influenced by three factors: deterioration of post-pandemic vintages, LTV compression on used vehicles (with 53% of originations exceeding 120% LTV by Q2 2025), and a decline in recoveries through the collection agency or auction pipeline (with a recovery ratio of 30.58% in the repossession pipeline in Q3 2025).
Legacy models use FICO scores, DPD buckets, and static attributes to predict overall NCO rates. A better approach is to automate the identification of Precision Impact Segments, defined as combinations of LMS payment velocity, tradeline behaviors, and vehicle characteristics, where charge-offs might be 2x to 5x higher than the portfolio average. dotData Signal Intelligence surfaces these patterns in hours, rather than the weeks it would take with manual analytics processes.
Delinquency is a leading indicator: an account that has missed payments but has not yet been written off. Charge-off is the accounting event — typically triggered at 120 days past due — where the lender removes the balance from its books as a realized loss. The strategic value of signal discovery lies in the delinquency window: the 90- to 180-day period between the first behavioral signal and the charge-off event is the only viable intervention window before capital is permanently impaired.
Negative equity directly affects Loss Given Default when a loan is written off. If a borrower defaults on a loan where the outstanding balance exceeds the vehicle’s value, repossession proceeds will fall short of covering the remaining principal. In the fourth quarter of 2025, almost 30% of new vehicle trade-ins were reported to have negative equity. Given that recovery ratios average around 30 cents on the dollar, lenders with high-LTV portfolios are expected to face net charge-offs that exceed the levels indicated by overall delinquency rates.
The most significant signals emerge from interactions across multiple tables over time: the connection between the composition of tradelines—covering particular account types, months of activity, and historical patterns of days past due (DPD)—and the behavior of payment methods within the LMS, as well as the attributes of vehicle collateral.
While a single increase in credit inquiries may seem manageable on its own, when it’s associated with a specific tradeline type and a partial-payment indicator in the LMS, it indicates a Precision Impact Segment with default rates two to three times higher than the baseline.
Traditional scorecards assess these factors in isolation and fail to account for the combined interactions.
Auto loan charge-offs do not stem from a lack of data. All tables that provide valuable insights are already integrated within your Loan Origination System (LOS), Loan Management System (LMS), credit bureau feeds, and alternative data sources. The challenge is whether current analytical workflows and tools can effectively merge these data points, prioritize what matters, and implement findings before losses are realized.
dotData Signal Intelligence addresses this challenge by augmenting the risk team’s judgment without requiring extensive modifications to your core systems. Discoveries are conducted automatically; SQL signals can be swiftly integrated into your existing Portfolio Management Analysis workflow, ensuring that the credit committee receives a well-documented, defensible Glass Box rule that offers predictive advantages.