Solving the Challenge of Time-Series Feature Engineering with Automation
- Technical Posts
Predictive analytics using time-series data is a widespread Machine Learning (ML) problem for real-world applications like churn prediction, demand forecasting, and preventative maintenance. This problem is challenging and often requires many data scientists and data engineers and countless hours spent on handling data. The data challenge is more pronounced when dealing with time-series transactional data combined with additional dimensional/master data sets.
KKBox’s Churn Prediction Challenge is one of the most popular time-series machine learning challenges on Kaggle developed from a real-world use case. KKBox is a leading music streaming service in Asia, similar to Spotify. Because it’s easier to retain clients than to acquire new ones, KKBox is interested in predicting which customers are likely to cancel their service or “churn.” Customers likely to churn may be offered incentives like coupons, a free month of service, upgraded functionality, etc., to minimize the overall churn volume for KKBox.
One challenge for this use case is the extremely large volume of time series data which is inherently difficult to analyze. Additionally, although incorporating dimensional information with time-series data may provide greater predictability for the predictions, this process is very time-consuming and requires a lot of domain expertise to properly leverage.
The typical approach to solve this data science problem is manual and requires weeks, often months of intensive work. We have applied dotData automation technology to accelerate the solution timeline and improve results to accelerate the process. In this case, dotData spent just one day using modern automated feature engineering (autoFE) and automated machine learning (autoML) technology. We automatically generated an accurate prediction pipeline using dotData’s autoFE/ML Python module from multiple, complex, unprepared input tables. dotData explored thousands of difficult, intelligent, and interpretable features, including automatically discovered aggregations and time windows as part of the feature engineering process.
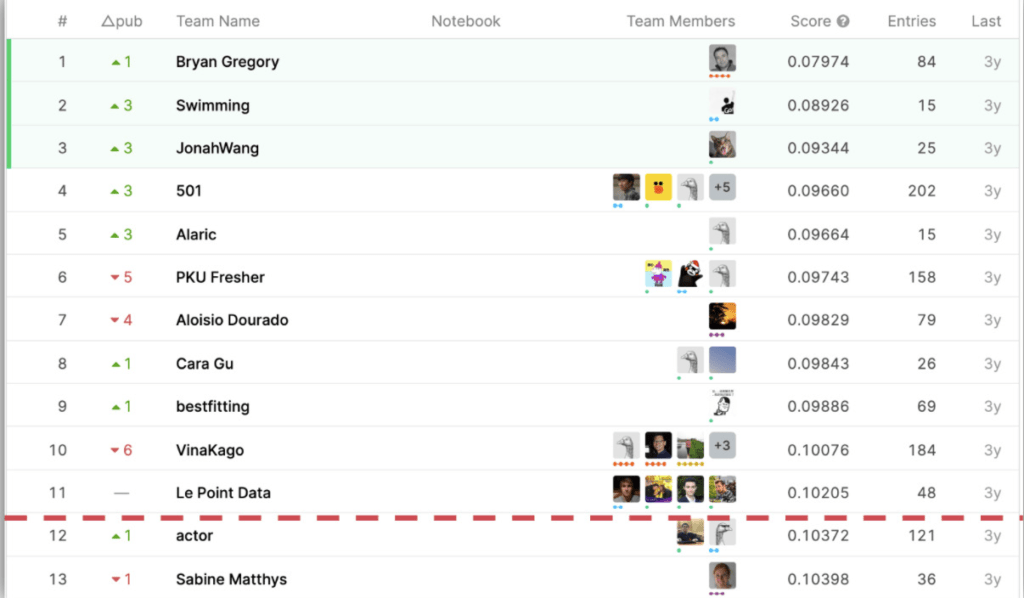
dotData then explored and optimized 23 different ML algorithms without any user inputs. Ultimately, dotData generated a solution that ranks 12th out of 575 competitors, with only a few hours of manual work – all performed in just one day. Below we describe the problem and the process involved. This competition lasted for three months, with participants, by comparison, often spending weeks or months developing their predictions.

Before applying machine learning algorithms, we must join the large tables into a single flat table, a process commonly known as feature engineering. However, because these joins are not one-to-one join, creating the joins can be difficult and often requires specific domain knowledge to understand how to properly combine the tables for the most appropriate context and value.

Data scientists address these issues in three steps:
The manual process described above may seem simple but is, in fact, iterative, time-consuming, and error-prone – especially when combining multiple tables with different time ranges or time resolutions. Another challenge is that while completing the sequence of steps, data scientists often run into a small subset of features that are too predictive to be practically useful for the problem of interest – this could be due to data leakage. Identifying and avoiding leaky features, especially for time series data is often hard, which makes the data science process more complex. Obviously, this type of manual approach in solving data science problems is difficult to scale and standardize.
dotData addresses these challenges through an intelligent automation process:
| User_ID | Churn_Flag |
| 1231 | -1 |
| 1232 | -1 |
| 1233 | 1 |
| 1234 | -1 |
| 1235 | -1 |

| User_ID | Month | Churn_Flag |
| 1231 | 01/31/2017 | -1 |
| 1232 | 01/31/2017 | -1 |
| 1233 | 01/31/2017 | 1 |
| 1234 | 01/31/2017 | -1 |
| 1235 | 01/31/2017 | -1 |

dotData automatically generates features and builds a model without human intervention with shared keys and time windows defined. During this process, dotData will automatically perform five critical tasks:
With just six hours of combined learning, configuration, and software operation, dotData placed 12th out of 575 participants:
In addition to providing highly accurate modeling results, dotData automatically built highly complex time-series features without requiring domain knowledge or inputs from domain experts. Below is a small sample of dotData derived features:
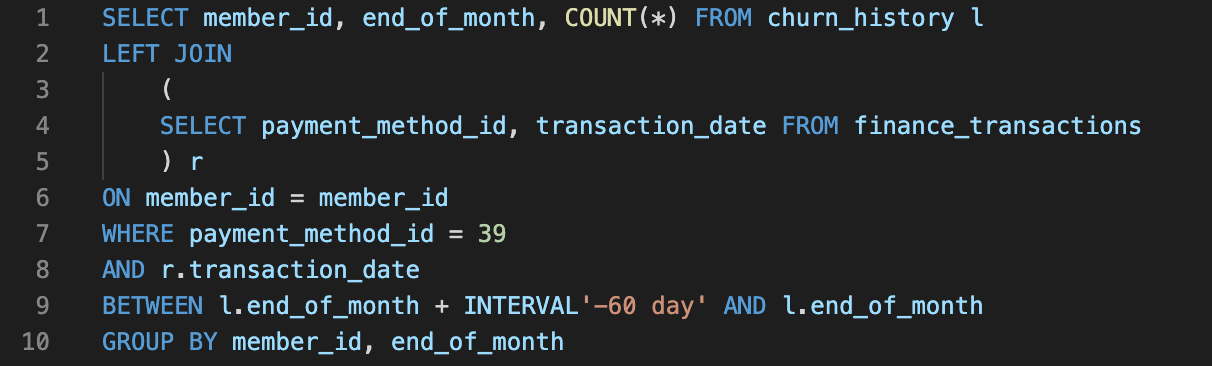
Feature 1
Users that use payment method “39” for most of their transactions in the past 60 days are more likely to churn.
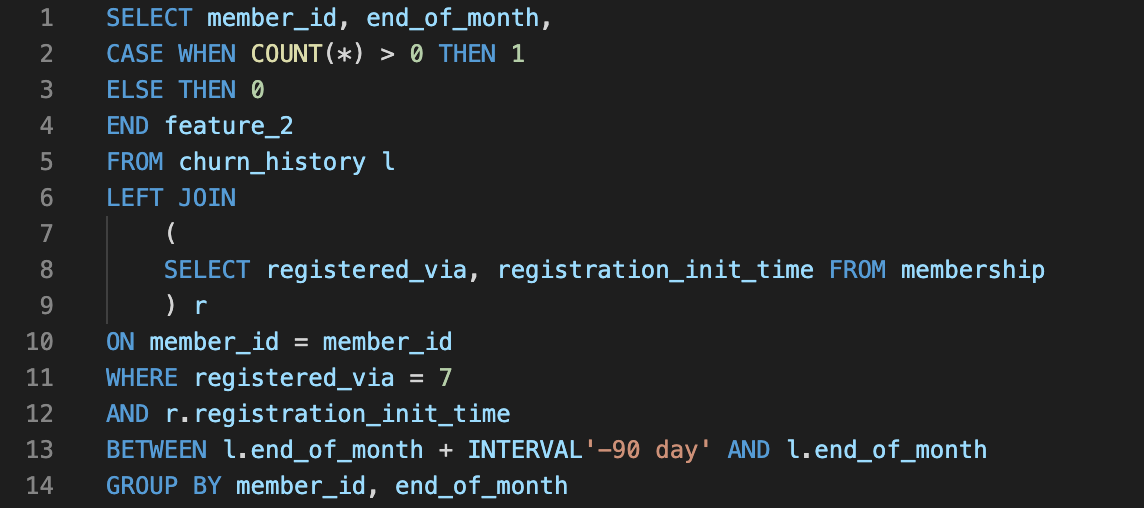
Feature 2
If users sign up for the service through campaign “7” during the past 90 days, they will not churn this month.
To manually build these features, a data scientist would need to write SQL queries similar to the ones shown below:
SQL Query for Feature 1
SQL Query for Feature 2
It’s important to note that, while the features shown above seem intuitive and straightforward, dotData has automatically explored thousands of features similar to these. A significant benefit of the automated discovery and evaluation of features is that it minimizes the chances that potentially important features will go undiscovered simply because the data scientist overlooked the possible impact of the sign-up channel on churn or the 60-day time range and its association to payment type.
Equally important is the impact of the manual coding process on feature output. Suppose a data scientist has to generate features manually. In that case, not only do they need to write the SQL queries, they must do so while hypothesizing the value of appropriate time ranges (one week, one month, half a year, etc.), the type of aggregation, and determining the optimal combination for a model. Of course, validating these hypotheses requires building the model and looking at feature importance metrics. This lengthy and repetitive process is equally likely to result in valuable results as it is to provide a dead end.
Automation technology can significantly boost performance, productivity, and efficiency when solving highly complex time series problems and achieving expert-level accuracy. The process required only minimal data preparation, and no subject matter expertise was sought or provided. The automation of the entire pipeline from processing multi-table to generating features to building machine learning models occurred in just six hours.
The end goal of automation is not to displace or replace the data scientist. However, when properly applied, automation provides a decisive breakthrough in helping data scientists productively explore a vast array of possibilities available in any given data set in just a few hours. Through automation, the manual and iterative experimentation process inherent in data science can be minimized while maintaining a high level of accuracy performance. As a result data scientists can focus more efforts on identifying worthy business problems and delivering impacts.
Learn more about how dotData can help automate your Feature Engineering process with a personalized demo