
Power your Feature Store using Automated Feature Engineering
- Technical Posts
The notion that “data is the new oil” has existed for a while. The analogy, however, is more appropriate than people often consider. Crude oil serves few concrete purposes in its raw state. It must be refined and processed before gasoline, for example, can power our vehicles. In the same fashion, raw data has little value to an organization. Like crude oil, we must refine, cleanse, transform, and often combine it with other data elements to elicit business insights and value. In the case of machine learning, the “gasoline” is what is known as “features.” Easy access to diverse and high-performance features is critical for successful machine learning projects.
While feature engineering has been around as long as data scientists have built machine learning models, feature stores are a relatively new concept.
A Feature store is a machine learning-specific system used to centralize storage, processing, and access of frequently used features. Feature stores intend to solve critical problems related to feature development and usage, e.g., feature reusability and skewness between development and production. However, many enterprises using feature stores face an uncomfortable reality – their feature stores are often empty. The challenge is where do we obtain features in the first place to serve in a feature store?

The process of extracting, transforming, and selecting features from raw data is known as feature engineering. Traditionally this process relies heavily on data scientists to manually prepare data, experiment with different hypotheses for feature definitions, and work with domain experts to iterate this process.
There are a few specific issues that make the process challenging. First, for a data scientist to start generating features from different data sources, one must understand the data at a column level, which is often not easy with enterprise data. Second, the business logic underlying each feature hypothesis needs to be solicited, with help from people with domain knowledge.
The constraints of building features often limit the scope only to well-known patterns, excluding unknown unknowns. Even with a clear logic on familiar data columns, the different combinations of parameters can lead to a sizeable feature space that is too difficult to explore manually. Finally, selecting features among all hypotheses for a target variable with a chosen algorithm type is complex.
A typical machine learning model requires tens to hundreds of features, so building such a volume of features for any given machine learning project could take weeks or even months to complete. The complexity and time-consuming nature of feature engineering are why it is unsurprising that data scientists can spend up to 80% of their time preparing data and generating features. This traditional feature engineering process needs refinement for an enterprise to scale its machine learning practice, and automated feature engineering is the key.
For example, let us look at these challenges with an open dataset – the Czech financial dataset. We would like to build a model to predict if a loan is likely to default, and we want to make such predictions when loan applications are submitted.

This dataset contains many tables, including the “Loan” table, the “Account” table, the “Transactions” table, and more. The “Loan” table contains the target variable “Default Status,” which our model will predict.
All the tables share some common identifier keys which can join them together, such as “Account_Id,” “Card_Id,” etc. For a data scientist to engineer features out of these tables, one has to join all these tables into one super dataset manually, select the columns of interest from this super-dataset, experiment on the proper aggregate functions, and apply various transformations. Given the number of tables to explore and the time series nature of this dataset, the feature engineering process can take many weeks or months of manual work that is required before a machine learning process can start.
Specifically, in this data, the “Transactions” table can be joined to the target table – the “Loan” table, based on “Account_Id” as the joining key. Since any account can have multiple transactions associated with it over time, we must decide on the aggregate functions to be applied to a chosen column in the “Transactions” table over a specific aggregate window. Features developed from this table might provide insights like: “the average transaction amount over 6 months before the loan application” or “the highest balance in the past year before the loan application.”
Considering all possible choices of the column (“Transaction Amount” vs. “Balance”), the aggregate function (average, min, max, etc.), and the aggregate window (6 months, past year, five years, etc.), it can theoretically lead to an infinite number of combinations to construct features. The aggregation choices and multiple column combinations make it highly time-consuming for a data scientist to manually develop features from this dataset and practically impossible to navigate the entire feature space to create good features manually.
Automated feature engineering (AutoFE) aims to automate a big part, if not all, of the feature engineering pipeline, including automatically joining different source tables, comprehensively exploring multiple feature hypotheses, and intelligently selecting only the most relevant features for a specific use case. With AutoFE, a data scientist can bootstrap the feature engineering step by pulling all relevant data together and quickly discover features that can form a good starting foundation for machine learning development. As a bonus, the ability of AutoFE to explore a vast feature space often leads to discovering hidden business insights.

dotData has developed its automated feature engineering to do precisely that. A user can feed tables directly into dotData specifying only the “join” keys between tables and letting dotData discover features automatically. The joining of tables and exploring aggregate functions plus windows happen automatically. Final features are selected based solely on their statistical performances without the bias of domain knowledge, preserving the potential to discover insights unknown to the business yet.
Instead of spending weeks to months going through the manual process, as discussed earlier, dotData can generate hundreds of features automatically for the Czech financial dataset in a few hours. As can be seen from the list of features that dotData automatically generates from this dataset, the different types of features dotData explore include but are not limited to:
dotData automatically explores all the variable parameters in feature hypotheses and identifies the statistically optimal combination.
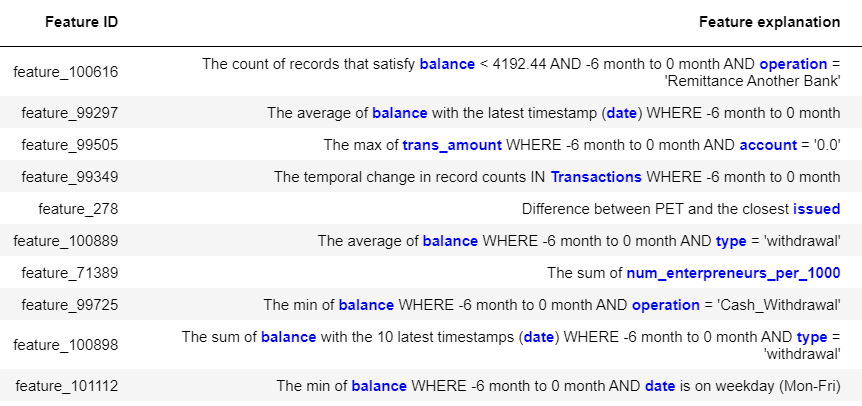
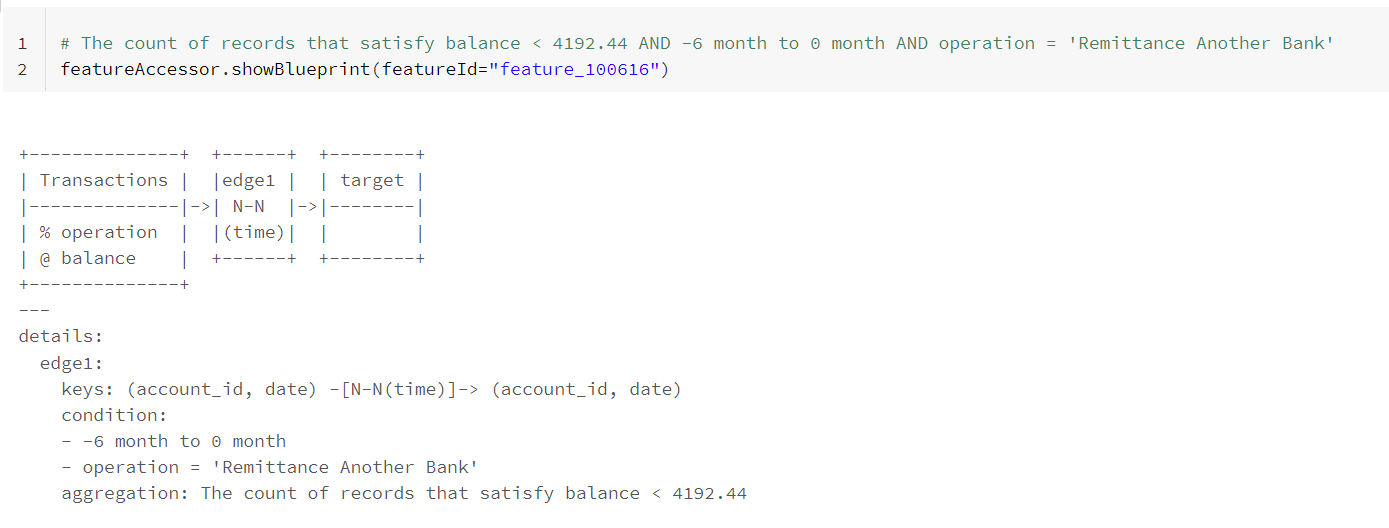
Let’s look at some specific features generated by dotData for this dataset. One such feature automatically discovered by dotData, feature_100616 listed above, extracts insights from the “Transactions” table. It counts the times the bank account balance drops below a certain threshold (4192.44) in the previous six months after each money transfer to another account. Here the threshold on balance, the time frame, and the “Operation” value are all discovered automatically without human instruction. With this feature discovered, a data scientist can discuss the business logic behind the feature definition with the business team before using the feature in a predictive model, especially the operation “Remittance Another Bank” and the discovered threshold 4192.44.
To generate this feature manually, the corresponding SQL query for this feature would read as follows:
SELECT load_id, count(*) AS feature_100616
FROM (
SELECT * FROM Transactions a JOIN target b
ON a.account_id = b.account_id
WHERE a.date >= add_months(b.date, -6) AND a.date < b.date
AND a.balance < 4192.44
AND a.operation = ‘Remittance Another Bank’
)
GROUP BY loan_id
While this may not be a highly complex SQL query, knowing the exact business logic to construct this SQL is not a trivial task. Even for a business expert, it may still not be obvious why one needs to look at the balance when money is sent to another account only during a specific time period – in this case, the past six months, instead of other scenarios. The more significant challenge is that constructing hundreds of such features is a practical impossibility given the subject matter expertise required to hypothesize possible feature combinations, let alone writing hundreds of snippets of SQL queries for the features in question.
Another highlight of dotData’s automated feature engineering technology is that all dotData features are interpretable in plain English, without mathematical transformations to obscure the business meaning. Each feature definition also directly refers to only the original tables and columns and thus tracks the data lineage to provide the type of transparency needed in large enterprises.
The strength of dotData’s automated feature engineering technology lies in its ability to generate complex features from multi-table data and the flexibility with which we can add tables to discover an even more significant number of features. As with all analytics scenarios, not all relevant and valuable data sets are at our disposal at the start of a project. As more data sets become available as the project progresses, dotData can quickly ingest them and leverage them for additional feature engineering experiments.
With dotData, after features are discovered based on training data, we can generate the same set of features on new data. Feature definitions are packaged as a feature model, guaranteeing that the same feature definition will be applied to both training and inference data. Feature values can be output from dotData’s tool and stored in the feature store, ready to be served for machine learning model development and production use.
dotData’s automated feature engineering platform is a Python-based product that can be installed in just about any Python development environment with an integrated Spark compute backend. dotData’s platform can work seamlessly in popular ML development environments like Databricks, MS Azure Synapse, and Azure ML. A Custom Spark cluster can also be set up for dotData if needed.
As more and more teams realize the importance of features and start adopting or implementing feature stores to speed up their MLOps practice, we believe dotData’s automated feature engineering can help bootstrap the feature engineering process and significantly accelerate time to features and models. With the power of automation, the feature engineering task no longer remains the bottleneck of machine learning development, and data scientists can invest their time in more valuable tasks of solving business problems. Please reach out to sales@dotdata.com if you are interested in learning more about this technology and scheduling a trial.
Learn more about how your organization could benefit from the powerful features of dotData by signing up for a demo.