
An Improved Approach to Time-Series Forecasting
- Technical Posts
Revenue and demand forecasting are among the most common use cases in data science, with abundant available data and clear business value across multiple industries. However, little agreement remains about the ‘best’ approach for building such forecasting models. New automated feature engineering tools are making that debate less relevant.
Algorithms such as ARIMA (Autoregressive Integrated Moving Average), SARIMA (Seasonal Autoregressive Integrated Moving Average), or XGBoost, remain popular due to their flexibility and interpretability. In a search for superior predictive performance, practitioners have been learning and incorporating an ever-expanding catalog of AI-based neural network architectures into their forecasting.
Despite often outperforming classical approaches in forecasting accuracy, neural networks are not a one-size-fits-all solution. Neural networks are mostly uninterpretable, leaving the business with limited insights into what’s driving the forecast, limiting business impact (or, in some cases, making models non-compliant with legislation).
Neural networks also require a higher level of expertise to implement and more resources to train and execute, and even for experts, identifying the ideal architecture for each problem remains difficult.
Choosing between accuracy and interpretability has left data scientists trying to keep up with an accelerating rate of literature and algorithm production, still no clear choice in what algorithm to select, and a decision between forecasting accuracy and interpretability.
However, automated ML and AI (AutoML/AI) are beginning to provide some clarity. Having gained traction over the past few years, AutoML tools like python’s TPOT module and Amazon’s Sagemaker give means to explore appropriate algorithms automatically. AutoML addresses some of the critical challenges described above, most notably:
However, traditional AutoML solutions are limited in scope, still requiring extensive manual data preparation (table joining and aggregation, data cleaning, null imputation, normalization, encoding, etc.) and data engineering, upon which model performance is heavily dependent. Traditional AutoML products also typically fail to address one of the major pain points: choosing between forecasting accuracy and interpretability.
The latest automation technology finally provides near-optimal forecasting accuracy and exceptional model interpretability. Unlike traditional autoML/AI, end-to-end automation automates the entire pipeline from raw relational data through preparation, modeling, tuning, and testing.
End-to-end automation speeds up the process immensely – eliminating the tedious, iterative, and time-consuming practice of feature-table preparation – and allows us to extract more value from the raw data than ever before, particularly in the case of vast and complex datasets.
We recently leveraged dotData’s end-to-end ML Automation to forecast item-level, monthly demand for a global manufacturer and distributor of medical equipment and supplies. By accessing raw, non-aggregated, multi-table data, hundreds of thousands of features were automatically explored and evaluated by dotData’s automated feature engineering algorithms.
This automatic discovery and analysis of features resulted in a significant lift to the performance of more interpretable models, enabling them to slightly outperform neural network architectures and three manually developed models used as a benchmark.
The solution was also developed in record time, in just two days, starting from raw data, with little-to-no manual data preparation, and with most of the two days spent waiting for the platform to complete its analysis.
The dataset consisted of 4 tables directly loadable from the host database.
| Table Name | Description |
|---|---|
| Historic_demand | The historic monthly demand for each item is split into countries, regions, and subregions. |
| Item_details | Information on each item, such as price, size, weight, type, date of release, etc. |
| Customer_info | information about each customer, their location, size, business type, etc. |
| Invoice_info | Invoice level information describing the Order size, value, customer, item, date, etc. |
Data preparation is the first thing to note about using dotData’s full-pipeline automation. The relevant data is stored in a relational database across multiple tables (see above).
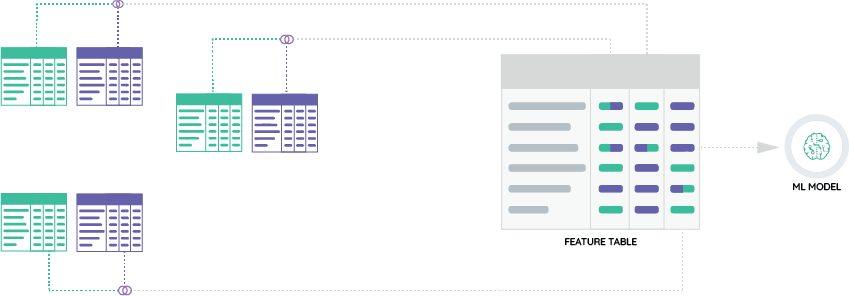
In the case of a traditional, manual approach – whether using Neural Networks, SARIMA, XGBoost, or Facebook’s Prophet – the tables must be manually condensed into a single flat table by the data scientist or a data engineer. In fact, in the case of most of these algorithms, a separate table is needed to train a different model for each item this multinational company sells (figure 1).
This conventional, manual table-generation process is not only labor-intensive but also essential, directly and significantly impacting the quality of the model. Machine learning models are only as good as the data used to train them.
However, in preparing an input table, the user must manually decide what data to include. It’s impossible to have ‘all’ data from every table since, for example, there may be millions of individual invoices worldwide for each item.
The user must condense this information based on their knowledge of the data, business, problem, and algorithm. Maybe order-level information does not matter and can be discarded. Alternatively, this information could be consolidated into a single value. For example, take “the total number of orders in the last month” and attach that to each item as a new feature.
Consolidation of data into a new value is called aggregation, a type of feature engineering. However, aggregation then creates a new problem, should the aggregation be based on “the total number of orders in the last month”? What about the mean or median, the minimum, or the standard deviation? Should the time interval be the last month, or should it be the year? What about this month last year? Or this day last week?
In short, condensing relational data into a flat table requires a lot of time, domain knowledge, skill, and, ideally, iterations, but it also requires data scientists to discard the vast majority of the original dataset. Even worse, there’s no correct answer to condense the data, as it varies significantly depending on the exact dataset, problem, and algorithm used for the model.
Feature engineering is arguably the most crucial step in building a good model, and yet there’s no manual way to know the impact of the work other than to experiment endlessly.
dotData provides an alternative to manual feature engineering that dramatically improves this process. Using distribution, we can automatically, intelligently, and systematically explore the feature space, capturing any predictive values in the data while simultaneously ensuring we generate only interpretable features (e.g., “the total number of orders of the item in the last month”).
In practice, this accelerates the model-building process immensely, results in a significant lift in performance, and generates new, data-driven, unbiased insights into what drives the model. By simply identifying what tables we have, how they relate to each other, and what column contains the variable we aim to predict (i.e., monthly demand), dotData does the rest.
This process is straightforward. While nearly every step happens automatically, the logs of what had happened, where, and why are output in plain English, both in real-time and for access later.
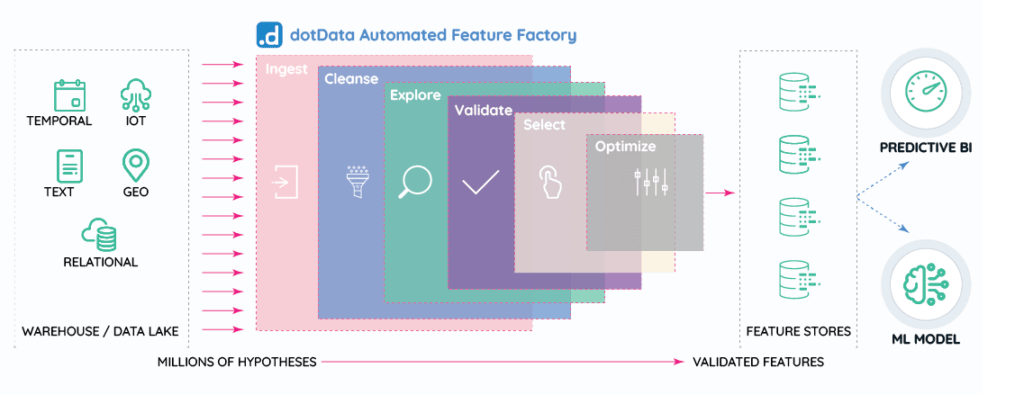
After some time identifying how to connect the tables and following the steps in figure 2, we had a model, its metrics, and the factors that drive it, all in just two days.
Of the 28 viable models, dotData identified, the top 3 most accurate forecasts (using RMSE) were all interpretable (XGBoost, lightGBM, and a Random Forest). With negligibly worse performance, just below were a variety of neural networks and other algorithms.
Choosing the best performing XGBoost model, predictions were then run for the following month. The ‘blind’ predictions performed similarly to neural networks. They also outperformed all three internal models, including a manually built and tuned series of Facebook’s Prophet’s models and a trained neural network for forecasting.
In a world of ever-increasing models of increasing complexity, full-pipeline AI/ML automation tools such as dotData provide an opportunity to generate accurate and interpretable forecasts consistently. In particular, new developments in automated feature engineering algorithms enable more value extraction from the data, improve model accuracy, provide new data-driven business insights, and save significant time in project development and pipeline deployment.
.