
Automated Feature Selection Methods to Assess Client Risk
- Technical Posts
In industries like Financial Services, Housing, and Insurance, the automated scoring of client risk can provide critical benefits. By quantifying the potential hazards for an organization, risk profiling helps organizations build sustainable long-term growth and minimizes losses in economic downturns. However, traditional client risk scoring methodologies are often not sufficient but can be augmented with machine learning-based models.
Popular use cases across different domains include:
Traditionally, businesses solved these use-cases with rule-based approaches. A banker might have used a credit score and household income to determine loan eligibility.
Simple rule-based logic is easy to implement but does not provide enough scalability and robustness as available data increases. Rule-based logic also tends to become tedious and difficult to manage as the number of variables increases.
In 2021 IDC estimated that global data creation and replication volume will grow by 23% through 2025 to a staggering 181 zettabytes by 2025. 181 Zettabytes is roughly equivalent to 250,000,000,000 DVDs. Simple rule-based models have become unwieldy and antiquated with both structured and unstructured data growth. A well-developed ML algorithm can build better risk profiles than a rules-based approach with better data quality.
While ML-based solutions for risk profiling outweigh rules-based approaches, there are challenges associated with building ML solutions. Problem formulation, model development, resource availability, domain expertise, validating model metrics, and customer adoption can impede successful ML projects.
Let’s consider a use case based on a widely available data set from a Czech bank to understand the challenges. The challenge is to predict if a customer is likely to default on a loan payment before the loan is approved.
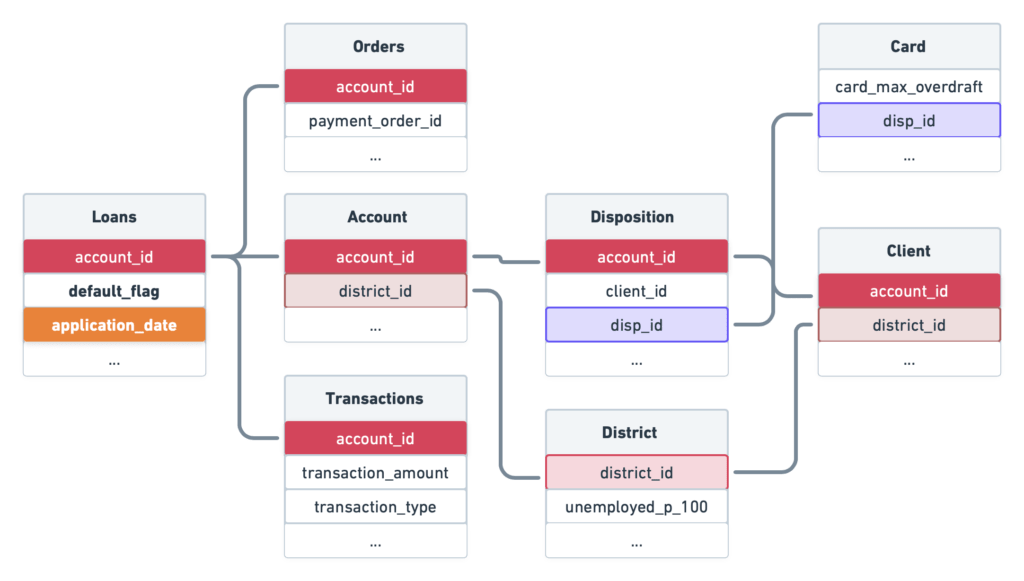
This dataset from the Czech Bank contains historical information about transactions before and after loans are provided. In addition, it also includes the details related to the order made, the number of accounts held by the customer, the number of clients tied to the main customer account, and more.
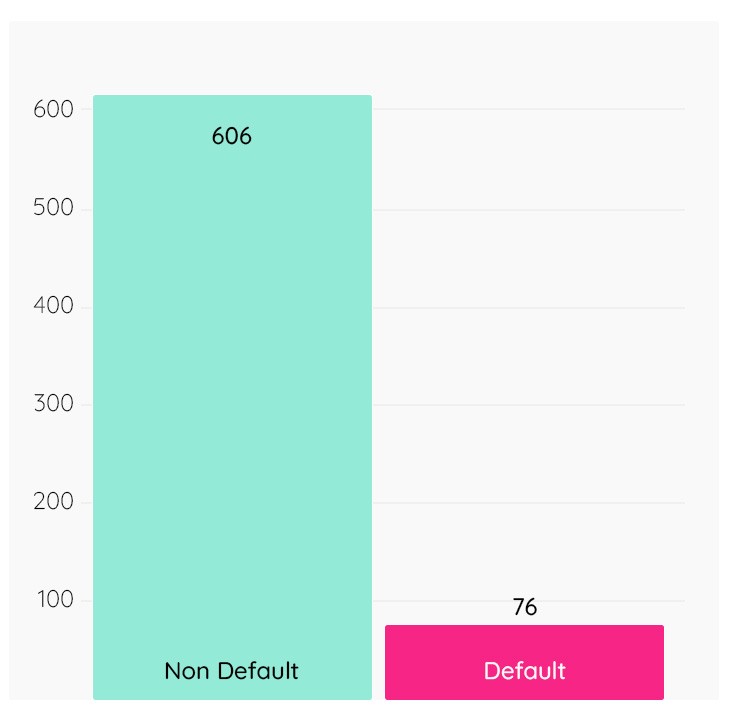
Out of 682 loans in the historical data, 76 defaulted on their loan, and 606 have paid their dues on time.
The data in our sample data set looks as follows:
| Table | Record Count |
|---|---|
| Loan | 682 |
| Order | 6,471 |
| Account | 4,500 |
| Disposition | 5,369 |
| District | 77 |
| Transaction | 1,050,000 |
| Client | 5,369 |
| Card | 892 |
Despite all the due diligence performed by the bank before providing loans, more than 11% of approved loans defaulted. The challenge for the bank is to be able to identify the likelihood that a borrower will default on the loans to reduce the 11% to a more acceptable number.
The objective of our ML model is to predict if a customer account id would end up defaulting on the issued loan. For 682 unique loans provided, there are 1.05 Million transactions available. Below is a snapshot of available transaction data:
| Account | Date | Type | Operation | Trans_amt | Balance |
|---|---|---|---|---|---|
| 1695 | 1/3/1993 | credit | Cash Credit | 200 | 200 |
| 1695 | 1/8/1993 | credit | Cash Credit | 11832 | 12032 |
| 1695 | 1/31/1993 | credit | 38.8 | 12070.8 | |
| 1695 | 2/2/1993 | credit | Cash Credit | 7500 | 19570.8 |
| 1695 | 2/28/1993 | credit | 50.1 | 19620.9 | |
| 1695 | 3/4/1993 | credit | Cash Credit | 5200 | 24820.9 |
A data scientist will need to extract features to build a model, for example:
The list is not exhaustive. The derived features vary based on data scientist knowledge and experience solving the risk-profiling or similar use cases. In a typical manual ML development cycle, the data scientist, often with the assistance of other developers like data engineers, would have to perform a series of steps as shown in the figure below:
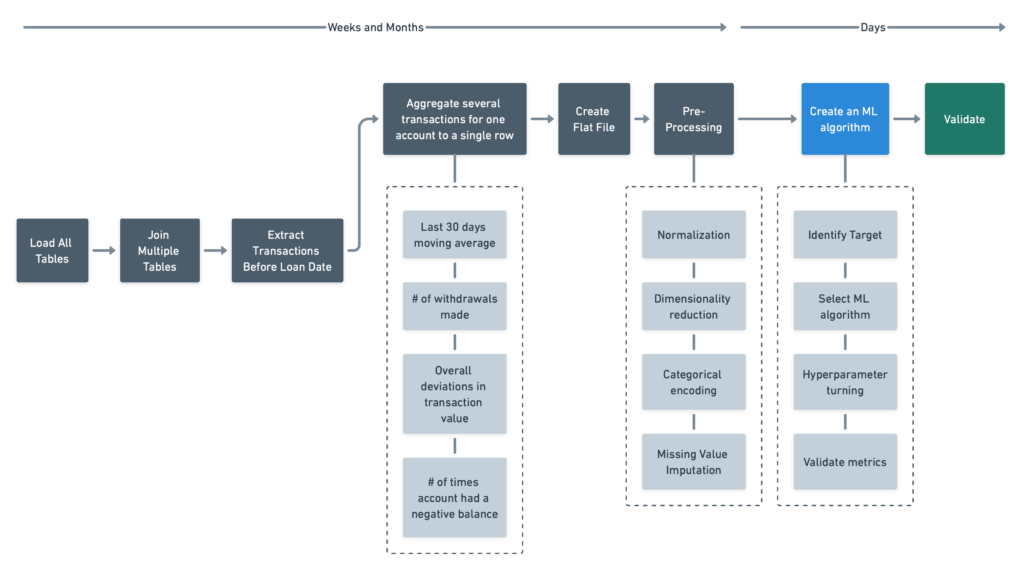
One of the most significant limitations of a manual approach is that as data is aggregated from multiple tables into a flat file, it could ignore valuable data since time and human resource constraints put limitations on how many table relationships and iterations are explored. It’s also not always easy to determine the time window based on which feature extraction needs to be done.
In a traditional ML development process, Data Scientists might rely on business domain experts to address some of these challenges and increase the likelihood that relevant data is used in the models. There are inherent limitations to this approach. Domain experts can only provide guidance based on personal experience and might miss patterns that, while not evident, might offer some valuable insights.
In addition, there are always more uncertainties: Is the correct model type used? Is the proper hyperparameter used? Etc…
Depending on the time constraints, resource availability, and impact of the problem, an experienced data practitioner could spend weeks to months solving these risk profiling use cases.
dotData is a platform that helps to accelerate problem formulation, model building, and deployment. dotData’s patented technology does the heavy-lifting for data practitioners to focus more on problem-solving.
At the heart of dotData’s technology is an AI-based system that connects directly to relational enterprise data – whether in a data warehouse or data lake – to automatically discover and analyze insights from millions of records across hundreds of tables and thousands of columns of data.
With dotData’s technology, feature engineering goes beyond simple permutations of existing features by giving the users a way of automatically discovering relevant patterns that might be of value to a model.
dotData’s Automated Feature Engineering provides three critical ways of assisting the data scientist in the feature discovery and evaluation process. First, it allows the user to import multiple data tables and define the entity relationships. dotData then automatically discovers and evaluates possible features from the available tables without manually forcing the user to build a flat table.
Second, dotData also provides a more traditional means of feature engineering by creating new features by combining existing features.
Finally, dotData’s platform is ideal for time-series-based problems because it’s capable of intelligent aggregation, automatically creating aggregations by day, week, month, etc., based on simple user inputs.
This powerful trifecta of feature engineering allows data scientists to focus their efforts on algorithm selection and optimization rather than feature development. It also accelerates time to value by giving subject matter experts insights into possible data patterns they may not know to make building high-value features fast and more accurate.
The auto machine learning functionality in the platform combines the features defined by the user and the features generated through Automated Feature Engineering. It efficiently applies those features for model building and runs several different models such as Linear (Linear Regression, Logistic Regression, SVM), Tree-Based (Light GBM, XGBoost, Decision Tree), and Neural Network-based models (Tensorflow, PyTorch) and report the summary metrics. The user can choose and deploy the best model based on their business needs.
By leveraging automation, the workflow becomes simplified as shown below:
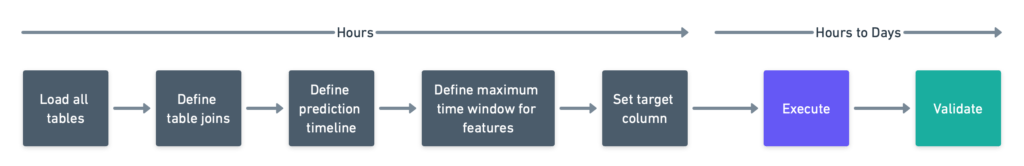
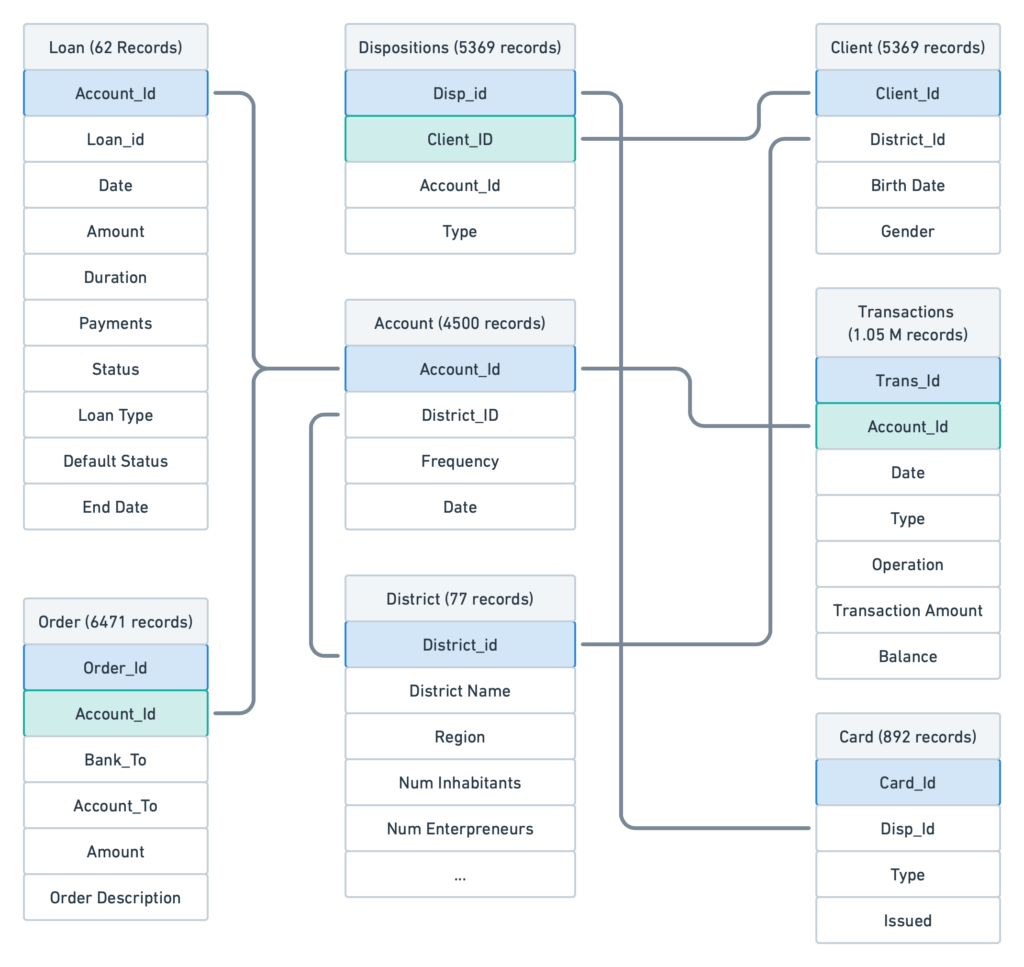
Once the user imports the loan, transactions, orders, and tables, they can define joins between them. For example, Loan and Account tables can be joined based on Account Id, card, and disposition table based on DispId and so on.
The use of joined tables eliminates the need to create a single flat file allowing the user to build and rebuild table relationships according to the nature of the problem.
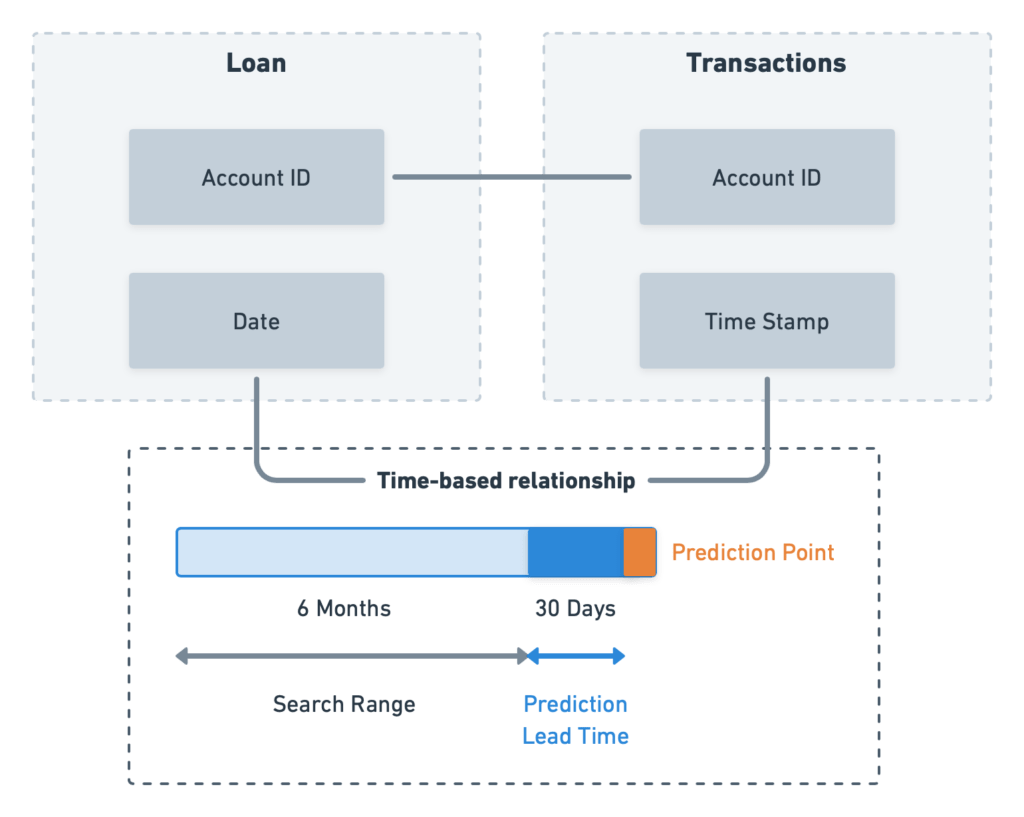
Similar to how we defined the relationships (or ‘joins’) between tables based on keys, dotData also has the functionality to relate tables based on a time range. Let’s assume that we need to predict loan default 30 days before approval for this use case. Leveraging time ranges can be carried out in two steps:
The user provides the lead time to prediction as 30 days. With time-based “joins” between tables, dotData automatically extracts only the transactions 30 days before loan approval. Using 30 days reduces data leakage, so no transactions after the loan are included.
Let’s assume that transactions six months before the loan opening date contain helpful information related to default prediction. Even if we are unsure of the time window to consider for aggregation, we could let dotData extract multiple time-based features within the search range of six months. dotData’s automated option automatically defines a search range and identifies features to help define the search range.
After defining the use case, database schema, and relationships, running the model is just a click away.
In 90 minutes,
dotData explored thousands of possible features and hundreds of Machine Learning models to predict individuals at risk of defaulting on their loans.
dotData identified the XGBoost algorithm as the best way to address this challenge and used automatic categorical and time-based features created by dotData.
This chart shows the top features that have a higher association with model performance. Many of the features are automatically built by dotData:
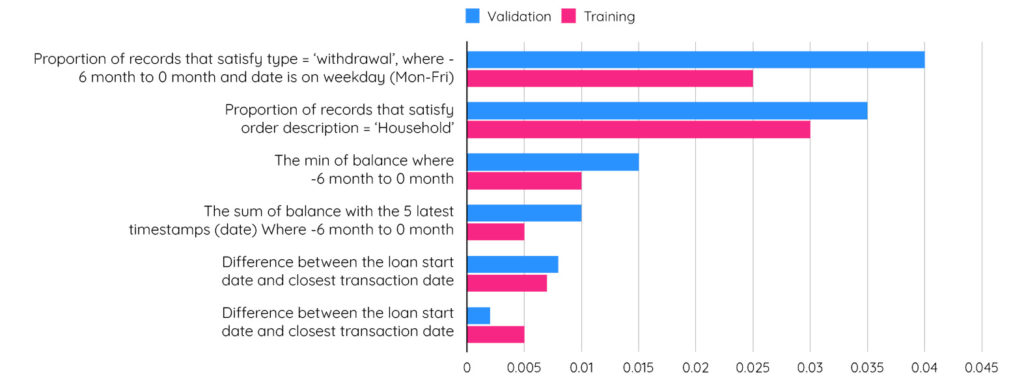
The discovered features identified some critical patterns for clients that have a higher risk of defaulting on their loans:
The confusion matrix helps monitor the performance of the classification model. It gives an understanding of the number of correctly identified, missed, and incorrect predictions:
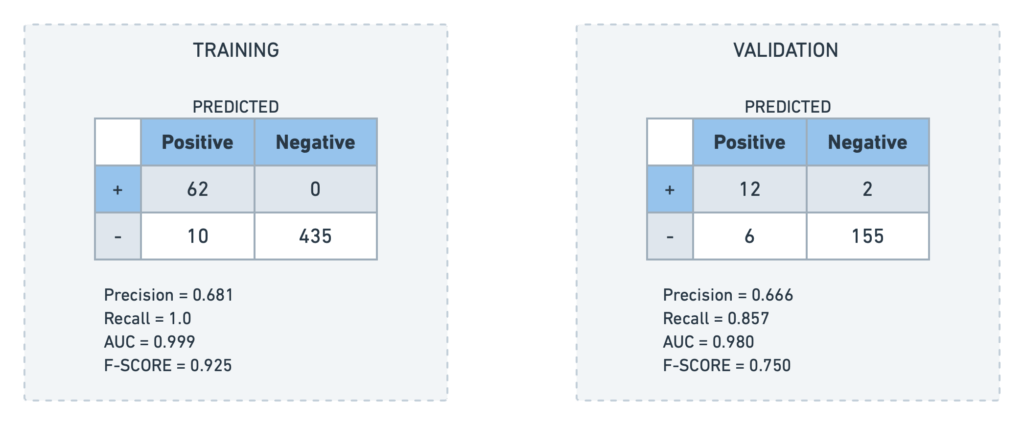
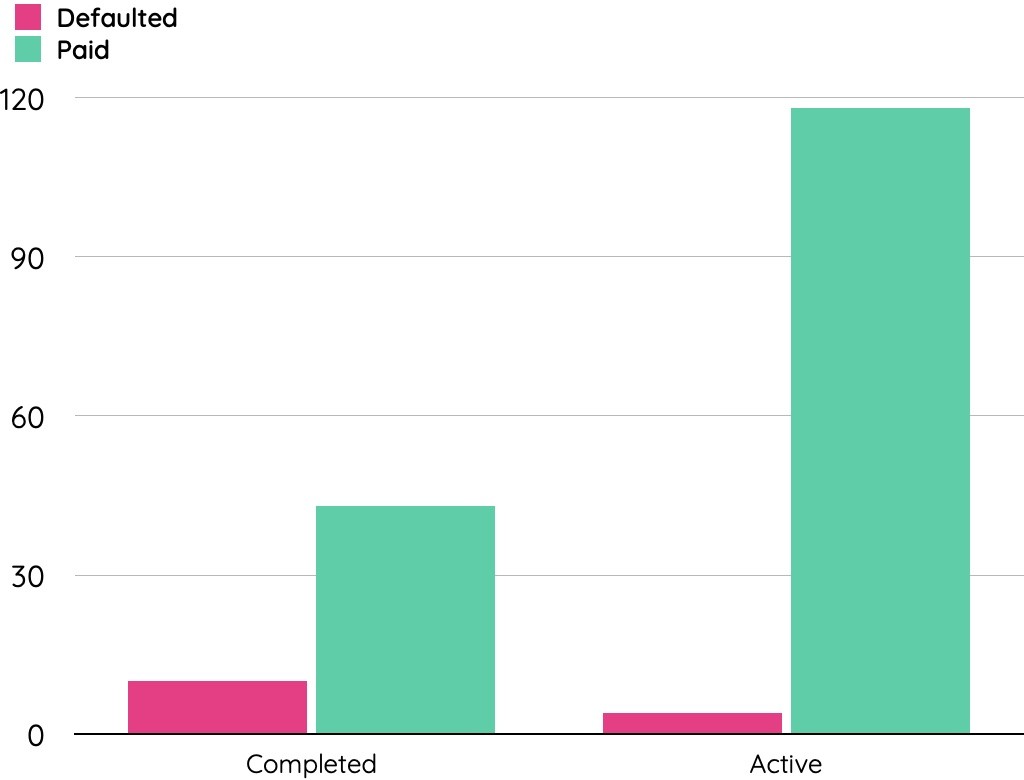
The confusion matrix showed that dotData successfully identified twelve of them before providing the loan of the fourteen actual defaults in the validation dataset. Out of 175 records in the validation dataset, 53 have completed the loan tenure. The rest of the loan belongs to the active type. We have considered loans that have completed the term for determining the cost avoidance of loss prevention.
dotData ML model successfully identified 8 out of 10 defaults before loan approval. By preventing loan approval on the eight account IDs predicted to default on loans, the bank could have saved over 388,000 Korunas (Czech currency). The two default loan account-ids that the model missed lost around 20,000 Korunas (Czech currency).
.
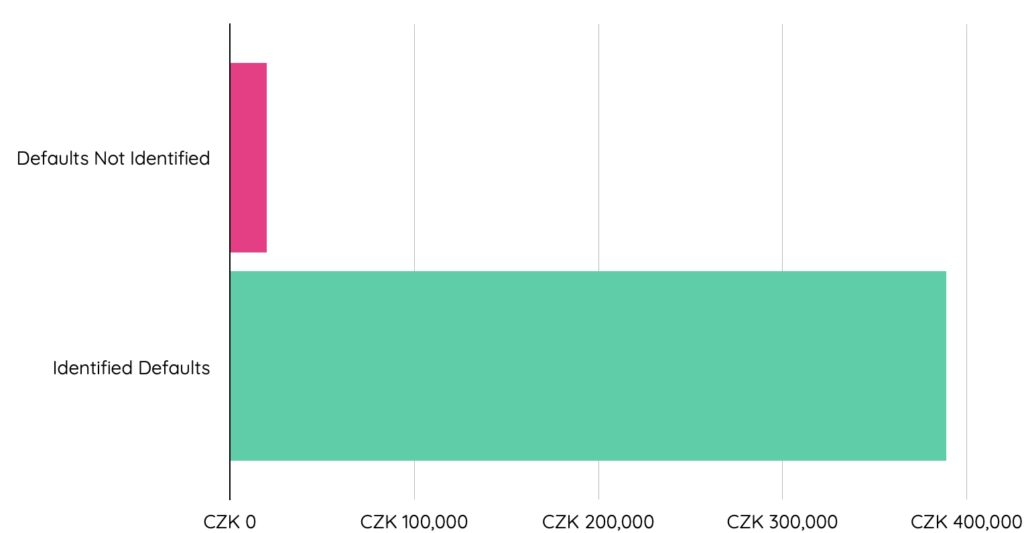
Applying ML for this use case clearly showed significant financial benefit, identifying 80% of likely defaults.
In this article, we discussed the need for applying ML to solve risk profiling use cases. We also discussed the challenges faced by data scientists that cause delays in delivering value and the limitations involved in building ML models manually. It also highlighted how some helpful information could get lost while aggregating multiple tables and the risks of limiting features based on domain knowledge.
We demonstrated how dotData helps in accelerating the process of model development. In essence, the product helps narrow down the focus of data professionals toward Delivering value by taking care of the heavy lifting associated with feature engineering and model development.
Finally, we showed how our award-winning features, such as key-based and time-based relationships across tables, auto time-based feature extraction, and automated model development process, could have saved Czech Bank from losing a significant amount of money – in just a few clicks!
Learn more about how your organization could benefit from the powerful features of dotData by signing up for a demo.